Proposal Template AI
Free proposal templates in word, powerpoint, pdf and more

How to Write Key Performance Indicators (KPIs) Section in a Proposal Template
When it comes to writing a proposal , it’s important to include a section on Key Performance Indicators (KPIs) to measure the success of the project. This section is crucial for setting clear and measurable goals that can be tracked throughout the project’s lifecycle. Here’s a guide on how to effectively write KPIs in a proposal template.
What Are KPIs?
KPIs are specific, measurable metrics that are used to evaluate the success of a project or initiative. They provide a clear understanding of how well the project is performing and whether it is meeting its objectives. KPIs can be tailored to each individual project and should align with the overall goals and objectives.
How to Write KPIs in a Proposal Template
When writing the KPIs section in a proposal template, it’s important to be specific and realistic. Start by identifying the main objectives of the project and then determine the metrics that will be used to measure the success of these objectives. Some common KPIs include:
- Financial Metrics : Revenue, ROI, Cost of Goods Sold
- Operational Metrics : Efficiency, Quality, Customer Satisfaction
- Project Metrics : Timeliness, Compliance, Scope
Each KPI should have a clear target or benchmark, a time frame for measurement, and a responsible party for monitoring and reporting. It’s important to ensure that the KPIs are relevant to the project and aligned with the overall business goals.
Q: What type of proposal templates is the KPIs section used in?
A: The KPIs section is commonly included in project proposals , business plans, and performance improvement plans. It is also often seen in funding proposals and grant applications.
Q: How many KPIs should be included in a proposal?
A: There is no set number of KPIs that should be included in a proposal. However, it’s best to focus on a few key metrics that are most relevant to the project and its objectives.
Q: How often should KPIs be reviewed and updated?
A: KPIs should be regularly reviewed, typically on a monthly or quarterly basis. Any necessary adjustments or updates can be made at these times to ensure they continue to align with the project’s goals.
Advice for End Users
When writing KPIs for a proposal, it’s important to involve key stakeholders and team members to ensure that the metrics are realistic and achievable. Additionally, consider using SMART criteria (Specific, Measurable, Achievable, Relevant, Time-bound) when setting KPIs to ensure they are well-defined and actionable.
In conclusion, including a KPIs section in a proposal is crucial for setting clear and measurable goals for a project. By following the tips outlined in this guide, you can effectively write KPIs in a proposal template to track the success of your project.
This information is relevant for project proposals , business plans, performance improvement plans, funding proposals, and grant applications.
Related Posts:
- Project Proposal Template: A Comprehensive Guide +…
- Simple Project Proposal Template: A Comprehensive…
- Inion Technology Project Proposal Template: A…
- Software Project Proposal Template: A Comprehensive…
- Internship Project Proposal Template: A…
- Construction Project Proposal Template: A…
- Project Management Request For Proposal Template: A…
- Community Project Proposal Template: A Comprehensive…
Filter by Keywords
51 Key Performance Indicator (KPI) Examples & Templates
Erica Golightly
Senior Writer
March 24, 2023
How do you encourage your team to think about and achieve organizational goals? The first step is to take a deep inventory of your key performance indicators (KPIs).
The thing is, KPIs will get the team motivated for the first few months, then lost in long email threads, and revisited the day before an important meeting with senior leadership.
Well-designed KPIs will empower teams to solve inefficiencies, eliminate time-sucking requests, and align tasks and projects with company-wide goals . This is what we want for you and your team, so we’ve put together a catalog of KPI examples and templates to answer your questions:
In what condition does a metric become a KPI? Who is part of the KPI development process? Where do I track KPI progress? How do I drive action and motivate my team toward the outcome?
We’ll cover all of the above—and then some—because KPIs are the secret sauce of modern business strategy. And everyone is qualified for the task.
What Is a KPI or Key Performance Indicator?
Sales kpi examples, operations kpi examples, finance kpi examples, marketing kpi examples, website kpi examples, design kpi examples, startup kpi examples, product kpi examples, saas kpi examples, human resources kpi examples, how to measure kpis in clickup .

A Key Performance Indicator or KPI is a quantifiable metric used to monitor progress in achieving business objectives. More specifically, a KPI gives performance insight into an organization’s most important asset: the people.
Businesses invest time, effort, and money to hire problem solvers—people who have strengths in analyzing and interpreting data to make decisions. And this investment isn’t limited to staffing the IT and Finance departments. It’s been said that a workforce with data literacy skills helps improve the company’s overall health and performance.
Meaning everyone—front-line employees, managers, and senior leadership—has an influence on organizational goals. So as a team leader, you have the responsibility to give the people thoughtful, specific, and measurable KPIs .
If you’re more of a visual learner, check out this vlog about setting KPIs!
How to Define KPIs
If you take one thing away from this guide, let it be this: effective key performance indicators allow people to make accurate and fast decisions .
The first mistake businesses make when they’re brainstorming KPIs is sending an email to all department leaders with the subject line: What Are You Going To Do About All Of These Really Bad Metrics?
Instead, businesses should target the metrics which have the most impact on their sustainability. When you focus on needle-moving projects, tools, and systems, you are building a business roadmap to maximize your speed towards revenue growth.
So here is a step-by-step checklist to help you start your KPIs the right way:
1. Identify business metrics directly related to business goals
Let’s start with the basics that Sales KPIs look different from Product KPIs , which are different from Finance KPIs . Ask your area direct performance indicator questions to understand what they want to achieve and their criteria for success . This group will use these business metrics as a guide for the next month, quarter, or year. If a key performance indicator does not contribute to a business goal , it’s gotta go!
- What’s the problem you want to solve in your process/team/organization?
- What’s the outcome you want to achieve?
- How will you measure success?
- How will you know if you’ve achieved your outcome?
Bonus: Product requirements document templates
2. Write out clear and specific key performance indicators
Once you have their insights, organize the metrics into two categories: leading and lagging indicators.
- Leading indicators will let them know if they need to pivot or adjust their strategy to get back on track toward achieving their desired outcome
- Lagging indicators are the opposite. These key performance indicators determine how well processes and updates are performed over a longer period of time
Pro Tip : It might be tempting to use corporate shorthand or fluffy words, but remember these KPIs are shared company-wide, so it has to be clear to everyone.
3. Get KPIs into a remote-first tool to record and monitor progress
We’ll say it: KPI reports are not the most thrilling to build.
It’s an (almost) everyday task requiring time to turn raw data into actionable insights. So much so, KPI reports typically have a short life span after it reaches an inbox for a few reasons:
- Reports are outdated by the end of the day because data changes by the hour
- Reports in a PDF or Excel format look different on various screens
- Reports sent through email are not secure
Getting the right information at the right time is a necessity for data-driven businesses. People want to access KPIs on their smartphones, desktops, and even on the big screen at the office. If you’re looking for a free dashboard tool to meet these needs, try ClickUp!
51 KPI Examples and Templates to Measure Progress
Here at ClickUp, we’re super fans of KPIs and you , so our team got to work and pulled together a list of key performance indicators and free templates sorted by the department or industry.
1. Customer Acquisition Cost : The total cost of acquiring a customer (includes costs spent on the sales process and through marketing efforts) 2. Sales Activities Per Rep : The total number of tasks completed in a given time period 3 . Lead to Client Conversation Rate : The percentage of leads converted in your sales process 4. Total Sales Revenue : The total revenue generated from your products over a defined period 5. Sales Cycle Length : The average time it takes between initial contact through closing
Try ClickUp’s Commission Tracking template
6. Overtime Hours : The number of hours worked by an employee beyond their normally scheduled working hours 7. Processes Developed : The number of improvements made to current operational 8. Inventory Costs : The total amount of all expenses related to storing unsold goods 9. Office Space Utilization : The percentage of the office space used by employees 10. Company Perks Usage : The percentage of perks used by employees
ClickUp’s Project Request and Approval template

11. Return on Equity : The measure of financial performance based on net income divided by shareholder equity 12. Net Profit Margin : The amount of money your company has after all expenses (interest, taxes, operating expenses, etc.) have been deducted from your total revenue 13. Cost of Goods Sold : The total cost of manufacturing the products a business sells (excludes sales, administration, and marketing expenses) 14. Debt to Equity Ratio : The ratio of company’s total liabilities against shareholder equity 15. Free Cash Flow : The amount of money remaining after capital expenditures
ClickUp’s Finance templates

16. Return on Marketing Investment : The return from a marketing investment divided by the costs of the marketing investment 17. Bounce Rate : The percentage of emails that bounced. This happens when the email address is no longer active 18. Click-through Rate : The number of people who clicked a link in your email vs. the total number of people who received your email 19. Organic Impressions : The number of times a piece of content is shown on a person’s newsfeed 20. Subscriber Count : The number of people who subscribed to your email marketing campaigns
Dive into more marketing KPIs and learn the best approach to set your goals!
ClickUp’s Campaign Tracking and Analytics template
21. Traffic to MQL (Marketing Qualified Lead) Ratio : The ratio of the total traffic platform generated vs. the number of marketing qualified leads coming from that traffic 22. Crawl Errors : The number of URLs that are inaccessible to Googlebot when it scans your pages 23. Bounce Rate : The number of people who exited your site within just a few seconds of arriving 24. Mobile Usability : The speed and performance of your landing page on phones and tabs 25. Referral Traffic : The number of people who visit your website from your social media
ClickUp’s Website Development template

26. Customer Satisfaction Rate : The responses let you know which customers are unhappy, and need some extra attention from your product management teams 27. Standard Compliance : The average number of issues related to not following brand guidelines , processes, or procedures 28. Response Time : The average time it takes for project reviewers and project contributors to respond back to questions, comments, and requests 29. Production Cycle Time : The average time it takes to complete a project from start to finish 30. Revision Time : The average number of rounds or time it takes to reach the final design
ClickUp’s Graphic Design template

31. Customer Lifetime Value : The revenue your company can expect from individual customer accounts 32. Activation Rate : The percentage of users who complete any major event in the onboarding process 33. Runway : The number of months the company can operate before running out of money 34. Average Sales Cycle Length : The number of days it takes to close a deal on average 35. Monthly Burn : The amount of cash spent per month
ClickUp’s Task Management template

36. Net Promoter Score (NPS) : The number indicating whether your users are ready to recommend your product to their friends, colleagues, etc. 37. Support Ticket Escalations : The number of tickets moved to a higher-level Customer Support Manager to resolve 38. Customer Satisfaction Rate (CSAT) : The scale rate of a customer’s overall experience with a company’s product, service, or employee 39. Velocity : The total number of manual and automated tests performed 40. Daily Active User : The number of active users per day
ClickUp’s Bug and Issue Tracking template
41. Net Promoter Score (NPS) : The number indicating whether your users are ready to recommend your product to their friends, colleagues, etc. 42. Month Over Month (MoM) Monthly Recurring Revenue (MRR) Growth Rate : The percentage increase or decrease month over month in net MRR 43. Annual Recurring Revenue (ARR) : The predicted amount of yearly revenue earned from customers 44. Churn Rate : The percentage rate at which customers leave a business over a given period of time 45. Processes Developed : The number of improvements made to current operational processes 46. Lead Velocity Rate : The total number of manual and automated tests performed
ClickUp’s Customer Support template

47. Recruiting Conversion Rate : The percentage of applicants who were hired vs. total number of applicants you processed ( track with ATS !) 48. Cost Per Hire : The total cost of hiring each employee (including hiring, training, or onboarding costs and other HR KPIs ) 49. Average Training Costs : The amount of money spent on employee training and development 50. Absenteeism Rate : The percentage of employees who are absent over a given time period 51. Employee Turnover Rate : The percentage of employees who left the company
ClickUp’s Hiring Candidates template
Once you’ve collected and measured your data, you’ll need to present them in an easy-to-understand format. This is where an all-in-one solution like ClickUp comes in clutch to provide the best visualization tools!
With your key performance indicators and templates ready to track, the next step is to compile them into a digital solution like ClickUp!
ClickUp is an all-in-one productivity platform where teams come together to plan, organize, and collaborate on work using tasks, Docs, Chat, Goals, Whiteboards, and more. Easily customized with just a few clicks, ClickUp lets teams of all types and sizes deliver work more effectively, boosting productivity to new heights!
Here’s a closer look at why teams love using ClickUp as their goal-tracking hub and KPI Dashboard:
Align KPI-related tasks and activities with Goals in ClickUp

Goals in ClickUp are high-level containers broken into smaller Targets. Once you take action on a Target, click the Target name to update your progress. Depending on which type you use, your Target will have different tracking options:
- Number : Create a range of numbers and track increases or decreases between them
- True/False : Use a Done/Not Done checkbox to mark your Target complete
- Currency : Set a monetary Goal and track any increases or decreases
- Task : Track the completion of a single task, or an entire List. (A badge appears in a task’s details with the name of the attached Goal!)
Leverage KPI reporting with ClickUp Dashboards

Dashboards in ClickUp will replace the weekly reports piling up in your manager’s inbox. Build, display, and interact from a single source of truth with all the KPIs front and center.
And you don’t need to be a data scientist or graphic designer to create Dashboards in ClickUp! With a drag-and-drop action, you can organize your Dashboards to visualize how work is happening in your Workspace in any way you want.

What are the benefits of tracking KPIs as a team?
KPIs help define clear and measurable criteria for success, allowing teams to work towards specific goals while continuously measuring their progress. This provides teams with a sense of direction, focus and purpose, which can lead to increased engagement and motivation.
How do you select KPIs for a team?
The selection of appropriate KPIs will depend on the team’s purpose, goals and objectives. While there is no one-size-fits-all approach, a team can identify KPIs by considering their goals and objectives, analyzing past performance, and considering external factors that may impact their performance.
What should I do if my team isn’t meeting KPI targets?
If your team is not meeting KPI targets, you should first try to identify the root cause of the issue . This may involve providing additional training, resources and support to members of the team. Additionally, you should review and revise the KPIs to make sure they are achievable, relevant and realistic.
Track Your Numbers With Confidence in ClickUp
Where is the team meeting, exceeding, or not making progress on KPIs? With KPI software , KPI timelines and reporting exist in a centralized location, so anyone can quickly retrieve the data and understand where they are and where they need to be.
It’s easy to get lost in the data for hours to generate a one-page KPI report. That’s the old way of productivity.
The right KPI software will simplify the reporting process and give you more time to focus on strategic discussions and activities.
Keep riding the growth wave, and if you need a fail-proof navigation tool, ClickUp’s got your back!
Questions? Comments? Visit our Help Center for support.
Receive the latest WriteClick Newsletter updates.
Thanks for subscribing to our blog!
Please enter a valid email
- Free training & 24-hour support
- Serious about security & privacy
- 99.99% uptime the last 12 months
More Like this
Kpi meaning + 27 examples of key performance indicators.
As your organization begins to sketch out what your strategic plan might look like, it’s likely to come to your attention that you’ll need to gain consensus around what your key performance indicators will be and how they will impact your organization. If you haven’t thought much about your KPIs yet, that’s okay. We can help!
We’ve compiled a complete guide that includes an overview of what makes a good KPI, the benefits of good key performance indicators, and a list of KPI examples [organized by department and industry] for your reference as you run your strategic planning process to build your organization’s strategic plan and goals.

Video Transcript – How to Write KPIs
Hi, my name is Erica Olsen. Today’s whiteboard video is on key performance indicators, or KPIs for short. These are those things that are associated with either goals or objectives, whatever you’re calling them, those elements of your plan that are the expressions of what you want to achieve by when those quantifiable outcome-based statements.
So KPI’s answer the quantifiable piece of your goals and objectives. They come in three different flavors. So we’ll talk about that in just a minute. But before we do, putting great measures together and making sure they work well for you, you need to have these four attributes. And before I talk about those four attributes, so I just want to say the reason they need to work well for you is because KPIs are the heartbeat of your performance management process. They tell you whether you’re making progress, and ultimately, we want to make progress against our strategy. So KPIs are the thing that do that for us. So you’re going to live with them a lot. So let’s make sure they’re really good.
Okay, so the four things you need to have in order to make sure your these measures work for you.
Our number one is your measure. So the measure is the verbal expression very simply, in words, what are we measuring, which is fairly straightforward. The tricky thing is, is we need to be as expressive as we possibly can with our measures. So number of new customers, that’s fine. There’s nothing wrong with that. But a little bit advanced or a little bit more expressive, would be number of new customers this year, or number of new customers for a certain product or a certain service. So what is it is it? Yeah, so it is, so be really clear. And when it comes to measuring it on a monthly basis, you’re gonna want to be as clear as possible. So number of new customers, let’s say this year,
Number two, is our target, or target is the numeric value that we want to achieve. So a couple of things that are important about this is, the target needs to be apples to apples with when the goal date is set, or the due date is set. So we want to achieve 1000 new customers by the end of the year. This is your time frame. So the due date in the target works hand in hand. The other thing is the measure and the target need to work hand in hand. So it’s a number. So this is a number, this is a percentage, this is a percentage, you get the idea.
Third thing, we actually run a report on this data. So where is it coming from? Be clear about what the source is. Most organizations have all sorts of data sources, fragmented systems. So making sure you identify where this data is coming from will save you a lot of time.
And then frequency. So how often are you going to be reporting on this KPI, ideally, you’re running monthly strategy reviews to report on the progress of your plan, at least monthly, in which case we’d like to see monthly KPIs. So you got to be able to pull the data monthly in order to make that happen. That’s not always possible. But let’s try to get there. Certainly some organizations are weekly and others are daily, monthly is a good place to start. So frequency. Great.
So now we know the components that we need to have in place in order to have our KPIs. Here are some different types of KPIs that you might think about as you’re putting your plan together.
So there are just straight up raw numbers, I call these widget counting, there’s nothing wrong with widget counting, they don’t necessarily tell a story. And I’ll talk about how to make this tell a story in a minute. But this is just simply widget counting number of things.
The second thing is progress. So this is really often used, it’s great. We use this, which is expressed as percent complete percent complete of the goal, percent completed a project, whatever it might be, it’s a project type measure. It’s a good measure, if if you don’t have quantifiable measures, or you can’t get the data, and you just want to track the performance of the goal as it relates to action items being completed under it.
The third type of indicator is a Change Type Indicator, like percent increase in sales, making this better would be percent increase in sales compared to last year. And the idea is 22%. So you can see how that starts to be more expressive, and work with the target. So this serves to tell a little bit more of a story than this one does, right? And if you want to actually make your widget counting measures tell more of a story like this one does, you might change something like this to read percentage of new customers acquired compared to same time last year. So that’s an example.
Okay, so now we know what we have to have in place and kind of different types of measures to get our ideas flowing. Let’s talk about one thing that you might take your measure writing to the next level and that is think about the fact that there are leading and lagging measures so are leading and lagging indicators. So percent increase in sales or sales is a lagging indicator it occurred as an outcome. If you want to make sure that you’re on track ACC, you might have a KPI in place, which is telling us whether we’re going to hit that increase such as your pipeline, maybe number of leads, or the size of your pipeline. So we don’t want to over rotate on this necessarily, but we do want to make sure we have a combination of leading and lagging measures when we’re looking at our performance on a monthly basis.
So with that, that’s all we have for today. Hopefully you have what you need to write great KPIs for your organization. Happy strategizing. And don’t forget, subscribe to our channel.
What is a Key Performance Indicator KPI — KPI Definition
Key performance indicators, also called KPIs, are the elements of your organization’s plan that express the quantitative outcomes you seek and how you will measure success. In other words, they tell you what you want to achieve and by when.
They are the qualitative, quantifiable, outcome-based statements you’ll use to measure progress and determine if you’re on track to meet your goals or objectives. Good plans use 5-7 KPIs to manage and track their progress against goals.

DOWNLOAD THE FREE KPI GUIDE
KPI Meaning, and Why Do You Need Them?
Key performance indicators are intended to create a holistic picture of how your organization is performing against its intended targets, organizational goals, business goals, or objectives. A great key performance indicator should accomplish all the following:
- Outline and measure your organization’s most important set of outputs.
- Work as the heartbeat of your performance management process and confirm whether progress is being made against your strategy.
- Represent the key elements of your strategic plan that express what you want to achieve by when.
- Measure the quantifiable components of your goals and objectives.
- Measure the most important leading and lagging measures in your organization.
The Five Elements of a KPI
These are the heartbeat of your performance management process and must work well! Your plan’s strategic KPIs tell you whether you’re making progress or how far you are from reaching your goals. Ultimately, you want to make progress against your strategy. You’ll live with these KPIs for at least the quarter (preferably the year), so make sure they’re valuable!
Great strategies track the progress of core elements of the plan. Each key performance indicator needs to include the following elements:
- A Measure: Every KPI must have a measure. The best ones have more specific or expressive measures.
- A Target: Every KPI needs to have a target that matches your measure and the period of your goal. These are generally a numeric values you’re seeking to achieve.
- A Data Source: Each of these needs to have a clearly defined data source so there is no gray area in measuring and tracking each.
- Reporting Frequency: Different measures may have different reporting needs, but a good rule to follow is to report on them at least monthly.
- Owner: While this isn’t a mandatory aspect of your KPI statement, setting expectations of who will take care of tracking, reporting, and refining specific KPIs is helpful to your overall organizational plan.
Indicators vs. Key Performance Indicators
An indicator is a general term that describes a business’s performance metrics.
There can be several types of indicators a company may track, but not all indicators are KPIs, especially if they don’t tie into an organization’s overall strategic plan or objectives, which is a MUST!
Key Performance Indicators
On the other hand, a key performance indicator is a very specific indicator that measures an organization’s progress toward a specific company-wide goal or objective. We typically recommend you narrow down the KPIs your organization tracks to no more than 7. When you track too many goals, it can get daunting and confusing.
Pro Tip : You should only track the best and most valuable indicators that tie to your organization’s long-term strategic goals and direction.
Benefits of Good Key Performance Indicators
What benefits do key performance indicators have on your strategic plan, and on your organization as a whole? A lot of benefits, actually! They are extremely important to the success of your strategic plan as they help you track progress of your goals. Implementing them correctly is critical to success.
- Benefit #1: They provide clarity and focus to your strategic plan by measuring progress and aligning your team’s efforts to the organization’s objectives. They also show your measurable progress over time and create ways to track your organization’s continued improvement.
- Benefit #2: Key performance indicators create a way to communicate a shared understanding of success. They give your team a shared understanding of what’s important to achieve your long-term vision and create a shared language to express your progress.
- Benefit #3: They provide signposts and triggers to help you identify when to act. A good balance of leading and lagging key performance indicators allow you to see the early warning signs when things are going well, or when it’s time to act.
How to Develop KPIs
We’ve covered this extensively in our How to Identify Key Performance Indicators post. But, here’s a really quick recap:
Step 1: Identify Measures that Contribute Directly to Your Annual Organization-wide Objectives
Ensure you select measures that can be directly used to quantify your most important annual objectives.
PRO TIP: It doesn’t matter what plan structure you’re using – balanced scorecard, OKRs, or any other framework – the right KPIs for every objective will help you measure if you’re moving in the right direction.
Step 2: Evaluate the Quality of Your Core Performance Indicators
Select a balance of leading and lagging indicators (which we define later in the article) that are quantifiable and move your organization forward. Always ensure you have relevant KPIs. Having the right key performance indicators makes a world of difference!
Step 3: Assign Ownership
Every key performance indicator needs ownership! It’s just that simple.
Step 4: Monitor and Report with Consistency
Whatever you do, don’t just set and forget your goals. We see it occasionally that people will select measures and not track them, but what’s the point of that? Be consistent. We recommend selecting measures that can be reported upon at least monthly.
The 3 Common Types of KPIs to Reference as You Build Your Metrics
Key performance indicators answer the quantifiable piece of your goals and objectives . They come in three different flavors. Now that you know the components of great key performance indicators, here are some different ones that you might think about as you’re putting your plan together:
Broad Number Measures
The first type of KPI is what we like to call broad number measures. These are the ones that essentially count something. An example is counting the number of products sold or the number of visits to a webpage.
PRO TIP: There is nothing wrong with these, but they don’t tell a story. Great measures help you create a clear picture of what is going on in your organization. So, using only broad ones won’t help create a narrative.
Progress Measures
Progress key performance indicators are used to help measure the progress of outcomes . This is most commonly known as the “percent complete” KPI, which is helpful in measuring the progress of completing a goal or project. These are best when quantifiable outcomes are difficult to track, or you can’t get specific data.
PRO TIP: Progress KPIs are great, but your KPI stack needs to include some easily quantifiable measures. We recommend using a mixture of progress KPIs and other types that have clear targets and data sources.
Change Measures
The final type of KPI is a change indicator. These are used to measure the quantifiable change in a metric or measure. An example would be, “X% increase in sales.” It adds a change measure to a quantifiable target and is usually measured as a percentage increase in a given period of time.
The more specific change measures are, the easier they are to understand. A better iteration of the example above would be “22% increase in sales over last year, which represents an xyz lift in net-new business.” More expressive measures are better.
PRO TIP: Change measures are good for helping create a clear narrative . It helps explain where you’re going instead of just a simple target.
Leading KPIs vs Lagging KPIs
Part of creating a holistic picture of your organization’s progress is looking at different types of measures, like a combination of leading and lagging indicators. Using a mixture of both allows you to monitor progress and early warning signs closely when your plan is under or over-performing (leading indicator) and you have a good hold on how that performance will impact your business down the road (lagging indicator). Here’s a deep dive and best practices on using leading versus lagging indicators:
Leading Indicator
We often refer to these metrics as the measures that tell you how your business might/will perform in the future. They are the warning buoys you put out in the water to let you know when something is going well and when something isn’t.
For example, a leading KPI for an organization might be the cost to deliver a good/service. If the cost of labor increases, it will give you a leading indicator that you will see an impact on net profit or inventory cost.
Another example of a leading indicator might be how well your website is ranking or how well your advertising is performing. If your website is performing well, it might be a leading indicator that your sales team will have an increase in qualified leads and contracts signed.
Lagging Indicator
A lagging indicator refers to past developments and effects. This reflects the past outcomes of your measure. So, it lags behind the performance of your leading indicators.
An example of a lagging indicator is EBITA. It reflects your earnings for a past date. That lagging indicator may have been influenced by leading indicators like the cost of labor/materials.
Balancing Leading and Lagging Indicators
If you want to ensure that you’re on track, you might have a KPI in place telling you whether you will hit that increase, such as your lead pipeline. We don’t want to over-rotate on this, but as part of a holistic, agile plan, we recommend outlining 5-7 key performance metrics or indicators in your plan that show a mix of leading and lagging indicators. .
Having a mixture of both gives you both a look-back and a look-forward as you measure the success of your plan and business health. A balanced set of KPIs also gives you the data and business intelligence you need for making decision making and strategic focus. We also recommend identifying and committing to tracking and managing the same KPIs for about a year, with regular monthly or quarterly reporting cadence, to create consistency in data and reporting.
27 KPI Examples
Sales key performance indicators.
- Number of contracts signed per quarter
- Dollar value for new contracts signed per period
- Number of qualified leads per month
- Number of engaged qualified leads in the sales funnel
- Hours of resources spent on sales follow up
- Average time for conversion
- Net sales – dollar or percentage growth
- New sales revenue
- Growth rate
- Customer acquisition count
- Lead conversion rate
- Average sales cycle
Increase the number of contracts signed by 10% each quarter.
- Measure: Number of contracts signed per quarter
- Target: Increase number of new contracts signed by 10% each quarter
- Data Source: CRM system
- Reporting Frequency: Weekly
- *Owner: Sales Team
- Due Date: Q1, Q2, Q3, Q4
Increase the value of new contracts by $300,000 per quarter this year.
- Measure: Dollar value for new contracts signed per period
- Data Source: Hubspot Sales Funnel
- Reporting Frequency: Monthly
- *Owner: VP of Sales
Increase the close rate to 30% from 20% by the end of the year.
- Measure: Close rate – number of closed contracts/sales qualified leads
- Target: Increase close rate from 20% to 30%
- *Owner: Director of Sales
- Due Date: December 31, 2023
Increase the number of weekly engaged qualified leads in the sales from 50 to 75 by the end of FY23.
- Measure: Number of engaged qualified leads in sales funnel
- Target: 50 to 75 by end of FY2023
- Data Source: Marketing and Sales CRM
- *Owner: Head of Sales
Decrease time to conversion from 60 to 45 days by Q3 2023.
- Measure: Average time for conversion
- Target: 60 days to 45 days
- Due Date: Q3 2023
Increase number of closed contracts by 2 contracts/week in 2023.
- Measure: Number of closed contracts
- Target: Increase closed contracts a week from 4 to 6
- Data Source: Sales Pipeline
- *Owner: Sales and Marketing Team
Examples of KPIs for Financial
- Growth in revenue
- Net profit margin
- Gross profit margin
- Operational cash flow
- Current accounts receivables
- Operating expenses
- Average cost of goods or services
- Average account lifetime total value
Financial KPIs as SMART Annual Goals
Grow top-line revenue by 10% by the end of 2023.
- Measure: Revenue growth
- Target: 10% growt
- Data Source: Quickbooks
- *Owner: Finance and Operations Team
- Due Date: By the end 2023
Increase gross profit margin by 12% by the end of 2023.
- Measure: Percentage growth of net profit margin
- Target: 12% net profit margin increase
- Data Source: Financial statements
- *Owner: Accounting Department
Increase net profit margin from 32% to 40% by the end of 2023.
- Measure: Gross profit margin in percentage
- Target: Increase gross profit margin from 32% to 40% by the end of 2023
- Data Source: CRM and Quickbooks
- *Owner: CFO
Maintain $5M operating cash flow for FY2023.
- Measure: Dollar amount of operational cash flow
- Target: $5M average
- Data Source: P&L
- Due Date: By the end FY2023
Collect 95% of account receivables within 60 days in 2023.
- Measure: Accounts collected within 60 days
- Target: 95% in 2023
- Data Source: Finance
- Due Date: End of 2023
Examples of Customer Service KPIs
- Number of customers retained/customer retention
- Customer service response time
- Percentage of market share
- Net promotor score
Customer KPIs in a SMART Framework for Annual Goals
90% of current customer monthly subscriptions during FY2023.
- Measure: Number of customers retained
- Target: Retain 90% percent of monthly subscription customers in FY2023
- Data Source: CRM software
- *Owner: Director of Client Operations
Increase market share by 5% by the end of 2023.
- Measure: Percentage of market share
- Target: Increase market share from 25%-30% by the end of 2023
- Data Source: Market research reports
- Reporting Frequency: Quarterly
- *Owner: Head of Marketing
Increase NPS score by 9 points in 2023.
- Measure: Net Promoter Score
- Target: Achieve a 9-point NPS increase over FY2023
- Data Source: Customer surveys
- *Owner: COO
Achieve a weekly ticket close rate of 85% by the end of FY2023.
- Measure: Average ticket/support resolution time
- Target: Achieve a weekly ticket close rate of 85%
- Data Source: Customer support data
- *Owner: Customer Support Team
Examples of KPIs for Operations
- Order fulfillment time
- Time to market
- Employee satisfaction rating
- Employee churn rate
- Inventory turnover
- Total number of units produced or on-hand
- Resource utilization
Operational KPIs as SMART Annual Goals
Average 3 days maximum order fill time by the end of Q3 2023.
- Measure: Order fulfilment time
- Target: Average maximum of 3 days
- Data Source: Order management software
- *Owner: Shipping Manager
Achieve an average SaaS project time-to-market of 4 weeks per feature in 2023.
- Measure: Average time to market
- Target: 4 weeks per feature
- Data Source: Product development and launch data
- *Owner: Product Development Team
Earn a minimum score of 80% employee satisfaction survey over the next year.
- Measure: Employee satisfaction rating
- Target: Earn a minimum score of 80% employee
- Data Source: Employee satisfaction survey and feedback
Maintain a maximum of 10% employee churn rate over the next year.
- Measure: Employee churn rate
- Target: Maintain a maximum of 10% employee churn rate over the next year
- Data Source: Human resources and payroll data
- *Owner: Human Resources
Achieve a minimum ratio of 5-6 inventory turnover in 2023.
- Measure: Inventory turnover ratio
- Target: Minimum ratio of 5-6
- Data Source: Inventory management software
- *Owner: perations Department
Marketing KPIs
- Monthly website traffic
- Number of marketing qualified leads
- Conversion rate for call-to-action content
- Keywords in top 10 search engine results/organic search
- Blog articles published this month
- E-Books published this month
- Marketing campaign performance
- Customer acquisition cost
- Landing page conversion rate
Marketing KPIs as SMART Annual Goals
Achieve a minimum of 10% increase in monthly website traffic over the next year.
- Measure: Monthly website traffic
- Target: 10% increase in monthly website
- Data Source: Google analytics
- *Owner: Marketing Manager
Generate a minimum of 200 qualified leads per month in 2023.
- Measure: Number of marketing qualified leads
- Target: 200 qualified leads per month
- Data Source: Hubspot
Achieve a minimum of 10% conversion rate for on-page CTAs by end of Q3 2023.
- Measure: Conversion rate on service pages
- Target: 10%
- Due Date: End of Q3, 2023
Achieve a minimum of 20 high-intent keywords in the top 10 search engine results over the next year.
- Measure: Keywords in top 10 search engine results
- Target: 20 keywords
- Data Source: SEM Rush data
- *Owner: SEO Manager
Publish a minimum of 4 blog articles per month to earn new leads in 2023.
- Measure: Blog articles
- Target: 4 per month
- Data Source: CMS
- *Owner: Content Marketing Manager
- Due Date: December 2023
Publish at least 2 e-books per quarter in 2023 to create new marketing-qualified leads.
- Measure: E-Books published
- Target: 2 per quarter
- Data Source: Content management system
Bonus: +40 Extra KPI Examples
Supply chain example key performance indicators.
- Number of on-time deliveries
- Inventory carry rate
- Months of supply on hand
- Inventory-to-sales Ratio (ISR)
- Carrying cost of inventory
- Inventory turnover rate
- Perfect order rate
- Inventory accuracy
Healthcare Example Key Performance Indicators
- Bed or room turnover
- Average patient wait time
- Average treatment charge
- Average insurance claim cost
- Medical error rate
- Patient-to-staff ratio
- Medication errors
- Average emergency room wait times
- Average insurance processing time
- Billing code error rates
- Average hospital stay
- Patient satisfaction rate
Human Resource Example Key Performance Indicators
- Organization headcount
- Average number of job vacancies
- Applications received per job vacancy
- Job offer acceptance rate
- Cost per new hire
- Average salary
- Average employee satisfaction
- Employee turnover rate
- New hire training Effectiveness
- Employee engagement score
Social Media Example Key Performance Indicators
- Average engagement
- % Growth in following
- Traffic conversions
- Social interactions
- Website traffic from social media
- Number of post shares
- Social visitor conversion rates
- Issues resolved using social channel
- Social media engagement
Conclusion: Keeping a Pulse on Your Plan
With the foundational knowledge of the KPI anatomy and a few example starting points, it’s important you build out these metrics with detailed and specific data sources so you can truly evaluate if you’re achieving your goals. Remember, these will be the 5-7 core metrics you’ll live by for the next 12 months, so it’s crucial to develop effective KPIs that follow the SMART formula. They should support your business strategy, measure the performance of your strategic objectives, and help you make better decisions.
A combination of leading and lagging KPIs will paint a clear picture of your organization’s strategic performance and empower you to make agile decisions to impact your team’s success.
Need a Dedicated App to Track Your Strategic Plan with KPI Dashboards? We’ve got you covered.
The StrategyHub by OnStrategy is a purpose built tool to help you build and manage a strategic plan with KPIs. Run your strategy reviews with zero prep – get access to our full suite of KPI reports, dynamic dashboards for data visualization, access to your historical data, and reporting tools to stay connected to the performance of your plan. Get 14-day free access today!
Our Other KPI Resources
We have several other great resources to consider as you build your organization’s Key Performance Indicators! Check out these other helpful posts and guides:
- OKRs vs. KPIs: A Downloadable Guide to Explain the Difference
- How to Identify KPIs in 4 Steps
- KPIs vs Metrics: Tips and Tricks to Performance Measures
- Guide to Establishing Weekly Health Metrics
FAQs on Key Performance Indicators
KPI stands for Key Performance Indicators. KPIs are the elements of your organization’s business or strategic plan that express what outcomes you are seeking and how you will measure their success. They express what you need to achieve by when. KPIs are always quantifiable, outcome-based statements to measure if you’re on track to meet your goals and objectives.
The 4 elements of key performance indicators are:
- A Measure – The best KPIs have more expressive measures.
- A Target – Every KPI needs to have a target that matches your measure and the time period of your goal.
- A Data Source – Every KPI needs to have a clearly defined data source.
- Reporting Frequency – A defined reporting frequency.
No, KPIs (Key Performance Indicators) are different from metrics. Metrics are quantitative measurements used to track and analyze various aspects of business performance, while KPIs are specific metrics chosen as indicators of success in achieving strategic goals.
16 Comments
HI Erica hope your are doing well, Sometime Strategy doesn’t cover all the activities through the company, like maintenance for example may be quality control …. sure they have a contribution in the overall goals achievement but there is no specific new requirement for them unless doing their job, do u think its better to develop a specific KPIs for these department? waiting your recommendation
Thanks for your strategic KPIs
Hello Erica, Could you please clarify how to set KPIs for the Strategic Planning team?
Hi Diana, check out the whitepaper above for more insight!
Hello Erica, Could you please clarify, how to set the KPIs for the Strategic PLanning team?
exampels of empowerment kpis
I found great information in this article. In any case, the characteristics that KPIs must have are: measurability, effectiveness, relevance, utility and feasibility
How to write methodology guidelines for strategy implementation / a company’s review and tracking (process and workflow) for all a company’s divisions
support on strategizing Learning & Development for Automobile dealership
Could you please to clarify how to write the KPIs for the Secretary.
Check out our guide to creating KPIs for more help here: https://onstrategyhq.com/kpi-guide-download/
That’s an amazing article.
Could you please to clarify how to write the KPIs for the office boy supervisor
Could you please clarify how to write KPIs for the editorial assistant in a start up publishing company.
Kindly advice how I would set a kpi for a mattress factory
Comments Cancel
Join 60,000 other leaders engaged in transforming their organizations., subscribe to get the latest agile strategy best practices, free guides, case studies, and videos in your inbox every week..

Leading strategy? Join our FREE community.
Become a member of the chief strategy officer collaborative..

Free monthly sessions and exclusive content.
Do you want to 2x your impact.
A Step-by-Step Guide: How to Develop Key Performance Indicators?
Key Performance Indicators (KPIs) are crucial tools for measuring and tracking the progress of your business objectives.
Whether you’re aiming to increase revenue, improve customer satisfaction, or enhance operational efficiency, well-developed KPIs provide valuable insights into the health and performance of your organization.
However, developing effective KPIs requires careful consideration and strategic alignment with your business goals.
This blog post is about how to develop key performance indicators that drive success.
From understanding the purpose of KPIs to selecting the right metrics, designing measurement systems, and analyzing data, this guide will equip you with the knowledge and tools necessary to create meaningful KPIs and unlock valuable business insights.
So, let’s dive in and discover the key to measuring and achieving your desired outcomes with precision.
What are Key Performance Indicators?
Key Performance Indicators or KPIs, are quantifiable metrics used to measure and evaluate the performance of an organization, team, or individual in achieving specific business objectives.
These indicators are carefully selected to provide actionable insights into critical areas of performance, allowing businesses to monitor progress, identify strengths and weaknesses, and make informed decisions.
The primary purpose of KPIs is to align strategic goals with measurable outcomes. They serve as a means to track performance and assess whether targets are being met.
Why are Key Performance Indicators Important?
Using Key Performance Indicators (KPIs) offers numerous benefits to organizations. Here are some of the key advantages of implementing KPIs in your business:
- Goal Alignment: KPIs ensure that all levels of the organization are aligned with strategic goals. By clearly defining and measuring progress towards these objectives, KPIs help create a unified focus and direction for the entire organization.
- Performance Measurement: KPIs provide a quantifiable way to measure performance and progress. They offer a clear view of how well specific goals and targets are being achieved, allowing for accurate assessment and comparison of performance over time.
- Data-Driven Decision Making: KPIs enable data-driven decision making by providing objective and relevant information. They help identify trends, patterns, and areas of improvement, allowing leaders to make informed decisions based on reliable metrics rather than subjective assessments.
- Focus and Prioritization: KPIs help organizations prioritize their efforts by identifying key areas of focus. By highlighting the most critical metrics, KPIs ensure that resources, time, and energy are directed towards activities that have the greatest impact on achieving strategic objectives.
- Performance Monitoring and Early Warning: KPIs serve as a monitoring tool, enabling organizations to proactively identify potential issues and take corrective action before they escalate. By setting thresholds or benchmarks for KPIs, businesses can receive early warnings of performance deviations and make timely adjustments.
- Accountability and Transparency: KPIs promote accountability within the organization. When individuals and teams have clear performance targets, they are more likely to take ownership of their responsibilities and be accountable for their results. KPIs also foster transparency by providing a shared set of metrics that can be easily communicated across the organization.
- Continuous Improvement: KPIs support a culture of continuous improvement by highlighting areas for enhancement. They help identify gaps, inefficiencies, and bottlenecks, prompting organizations to seek innovative solutions and refine processes to drive better performance.
- Performance Recognition and Incentives: KPIs can be used to recognize and reward high performance. By linking KPI achievements to performance-based incentives and recognition programs, organizations can motivate employees and teams to strive for excellence and align their efforts with strategic objectives.
Key characteristics of effective KPIs
Effective Key Performance Indicators (KPIs) possess several key characteristics that contribute to their usefulness and impact. When developing KPIs for your organization, consider the following characteristics to ensure their effectiveness:
- Relevance: Effective KPIs are directly aligned with the strategic objectives of the organization. They measure aspects of performance that are critical to achieving desired outcomes and provide insights into areas that significantly impact the success of the business.
- Measurability: KPIs should be measurable and quantifiable. They should be based on data that can be objectively collected, analyzed, and tracked over time. This allows for accurate and consistent measurement of performance and enables meaningful comparisons and analysis.
- Specificity: Well-defined KPIs are specific and clearly articulated. They should focus on a particular aspect of performance and provide a clear understanding of what is being measured. Vague or ambiguous KPIs can lead to confusion and hinder effective tracking and improvement efforts.
- Actionability: Effective KPIs drive action and provide insights that can be acted upon. They should highlight areas where improvement is needed and offer actionable information to guide decision-making and performance improvement efforts. Actionable KPIs empower individuals and teams to take targeted steps to enhance performance.
- Time-bound: KPIs should be time-bound, meaning they have a specific timeframe within which they are measured. This allows for tracking progress and assessing performance over a defined period. Time-bound KPIs also provide a sense of urgency and help establish clear deadlines for achieving targets.
- Alignment with benchmarks or targets: Effective KPIs are often set in relation to benchmarks or targets. They provide a reference point against which performance can be compared. Comparing actual performance to predetermined benchmarks or targets helps evaluate progress and identify areas for improvement.
- Reliable and Accessible Data: KPIs rely on accurate and reliable data to provide meaningful insights. It is important to ensure that the data used for KPI measurement is trustworthy, regularly updated, and easily accessible. Reliable data sources and robust data management systems contribute to the credibility and effectiveness of KPIs.
- Balance: A set of effective KPIs maintains a balance between different aspects of performance. They consider multiple dimensions such as financial, operational, customer satisfaction, employee engagement, and other relevant areas. A well-balanced set of KPIs provides a holistic view of performance and enables comprehensive evaluation.
Different types of Key Performance Indicators
There are various types of Key Performance Indicators (KPIs), each focusing on different aspects of organizational performance. Here are some common types of KPIs that span different areas of business:
- Financial KPIs: These KPIs measure financial performance and help assess the organization’s profitability, revenue generation, cost management, and financial stability. Examples include revenue growth rate, gross profit margin, return on investment (ROI), and cash flow.
- Operational KPIs: Operational KPIs evaluate the efficiency and effectiveness of business operations. They focus on key processes, productivity, quality, and resource utilization. Examples include production cycle time, order fulfillment rate, customer complaints resolved, and inventory turnover.
- Customer KPIs: Customer-centric KPIs assess various aspects of customer satisfaction, loyalty, and engagement. They provide insights into customer behavior, preferences, and the overall customer experience. Examples include customer satisfaction score (CSAT), Net Promoter Score (NPS), customer retention rate, and average order value.
- Sales and Marketing KPIs: These KPIs measure the effectiveness of sales and marketing efforts in generating leads, acquiring customers, and driving revenue. Examples include conversion rate, lead-to-opportunity ratio, customer acquisition cost (CAC), and marketing return on investment (ROI).
- Employee KPIs: Employee-focused KPIs evaluate individual and team performance, employee engagement, and development. They can include metrics such as employee satisfaction, training and development hours, employee turnover rate, and productivity per employee.
- Quality and Service KPIs: These KPIs assess the quality of products or services delivered by the organization. They measure aspects such as defect rate, service response time, customer complaints, and adherence to quality standards.
- Sustainability and Environmental KPIs: These KPIs focus on environmental and sustainability efforts within the organization. They evaluate metrics such as energy consumption, waste reduction, carbon footprint, and adherence to sustainability goals.
- Health and Safety KPIs: Health and safety KPIs monitor the organization’s commitment to maintaining a safe work environment. They can include metrics like accident frequency rate, near-miss incidents, compliance with safety regulations, and employee training hours on safety protocols.
Steps in Developing Key Performance Indicators
Here are seven essential steps that lead you to develop robust KPIs that drive performance, inform decision-making, and contribute to the achievement of your organizational objectives.
Step 1: Identify and Prioritize Strategic Goals
Begin by identifying the key strategic goals that will drive your organization’s success. These goals should be specific to your business and reflect what you aim to achieve within a defined timeframe. For example, increasing market share, expanding into new markets, improving customer satisfaction, or enhancing operational efficiency.
Ensure that your objectives align with your organization’s mission and vision statements. These statements define the purpose and long-term aspirations of your business. Aligning your objectives with them creates a sense of purpose and direction, ensuring that your KPIs contribute to the overall strategic direction of the organization.
Step 2: Selecting the Right KPIs
Once you have defined your business objectives, the next step is to identify the relevant metrics that will help measure progress and performance in relation to those objectives.
Break down each business objective into specific components or key focus areas. For example, if your objective is to increase customer satisfaction, relevant focus areas may include response time, complaint resolution rate, or customer retention.
Brainstorm a list of potential metrics that align with each focus area. Consider both quantitative and qualitative measures that provide insights into the specific aspect of performance you want to track.
For instance, if response time is a focus area, a relevant metric could be average response time to customer inquiries.
Step 3: Linking KPIs to strategic goals
Once you have identified the relevant metrics, the next step is to link them to your strategic goals. This linkage ensures that your KPIs directly contribute to the achievement of your overall strategic objectives.
Determine how each KPI directly relates to a specific strategic goal. Articulate how achieving the KPI will impact the progress towards the strategic objective. This connection helps create a clear line of sight between your KPIs and your broader business goals.
Ensure that each KPI aligns with only one or a few strategic goals. Avoid selecting KPIs that overlap or dilute the focus of your objectives. Each KPI should have a clear and direct relationship to a specific strategic goal, allowing for targeted measurement and improvement efforts.
Step 4: Establishing a data collection and management system
To effectively measure and track your KPIs, it’s important to establish a robust data collection and management system.
Identify the sources of data needed to measure each KPI. This may include internal systems, databases, surveys, customer feedback, or external sources. Ensure that the data sources are reliable and provide the necessary information for accurate measurement.
Define the processes and procedures for collecting data. Determine how and when data will be collected, who is responsible for data collection, and any necessary tools or technology required. Implement quality control measures to ensure data accuracy and consistency.
Step 5: Defining measurement methods and frequency
Determine the most appropriate methods for measuring each KPI. This could involve quantitative analysis, surveys, qualitative assessments, or a combination of methods. Consider the nature of the KPI and the available data when selecting measurement methods.
Identify the specific metrics and formulas used to calculate quantitative KPIs. Determine the units of measurement and any necessary calculations or aggregations.
For KPIs that involve subjective or qualitative data, define the assessment criteria and rating scales. Establish guidelines to ensure consistency and objectivity in the assessment process.
Determine how often each KPI will be measured and reported. The frequency may vary depending on the nature of the KPI and the need for real-time or periodic tracking. Consider the availability of data and the desired level of granularity when determining measurement frequency.
Assign clear responsibilities for data collection, analysis, and reporting. Identify the individuals or teams responsible for collecting the data, analyzing the results, and ensuring data integrity. Foster collaboration and communication among the responsible parties to facilitate effective KPI management.
Step 6: Creating a KPI reporting framework
Develop a reporting framework that outlines the structure and content of your KPI reports. Consider the following elements:
Determine the format of your KPI reports, such as dashboards, visualizations, or written summaries. Choose a format that effectively communicates the key information and insights.
Define the structure of the report, including the KPIs to be included, supporting metrics, targets or benchmarks, and any contextual information or analysis. Ensure that the report provides a clear and concise overview of performance.
Step 7: Visualization techniques for effective communication
Utilize visualization techniques to enhance the communication of KPI data. Visualizations such as charts, graphs, and infographics can make complex data more understandable and engaging. Choose visualizations that best represent the data and highlight trends, patterns, and performance gaps.
Choose visualizations that effectively represent the KPI data and highlight the key insights. Consider bar charts, line graphs, pie charts, or heatmaps, depending on the nature of the data and the message you want to convey.
Ensure that the visualizations are easy to interpret and understand. Use clear labels, appropriate color schemes, and appropriate scaling to enhance clarity and readability.
Final Words
Knowing how to develop key performance indicators is important skill because KPIs are crucial to measure progress and success in organizations. By following the essential steps of defining business objectives, identifying relevant metrics, and linking KPIs to strategic goals, you can ensure that your KPIs are aligned with your organization’s mission and vision.
Remember, the journey of developing and implementing KPIs is not a one-time event but an ongoing process. Regularly review and refine your KPIs to ensure their relevance and alignment with your evolving business needs. By leveraging the power of KPIs, you can gain valuable insights, track progress, make data-driven decisions, and foster a culture of continuous improvement, ultimately leading to enhanced performance and success for your organization
About The Author

Tahir Abbas
Related posts.
Key Elements of Nike Crisis Communication Plan with an Example

10 Best Practices of Change Advisory Board

Key Messages in a Crisis Communication Plan – Examples
- Customer Support
- Product Documentation
- Corporate Social Responsibility
- Diversity, Equality, Inclusion, and Belonging
- Academic Program
- Global Offices
- Support Portal
- Qlik Continuous Classroom
- Partner Portal
- Talend Cloud
- Talend Academy
Integrate, transform, analyze, and act on data

Qlik Staige
Bring your AI strategy to life with a trusted data foundation and actionable predictions

Integrations & Connectors
Connect and combine data from hundreds of sources
Featured Technology Partners

Data Integration and Quality
Build a trusted data foundation
Core Capabilities
- Data Streaming
- Application and API Integration
- Data Lake Creation
- Application Automation
- Data Warehouse Automation
- SAP Solutions
- Data Quality and Governance
- Stitch Data Loader
Guided Tour
Data Sources and Targets
Access and integrate the data you need to deliver greater business outcomes

Data Integration Buyer's Guide: What to Look for in a Data Integration Solution
Take action with AI-powered insight
Embedded Analytics
- Augmented Analytics
- Visualizations and Dashboards
Try for Free
Data Sources
Connect and combine data from hundreds of sources to fuel your ever-evolving analytics needs

Qlik Platform Services for Analytics
Maximize the value of your data with AI
- Integration and Connectors
- Qlik Staige - Artificial Intelligence Built-in

Generative AI Benchmark Report
All Data Integration and Quality Products
Qlik Cloud® Data Integration
Get a trusted data foundation to power your AI, ML, and analytics
Qlik Application Automation®
Automatically trigger informed action on most SaaS applications
Qlik Replicate®
Accelerate data replication, ingestion, and streaming.
Talend Data Fabric
Unify, integrate, and govern disparate data environments
Qlik Compose® for Data Lakes
Automate your data pipelines to create analytics-ready data sets
Talend Data Inventory
Find and improve data in a shared, collaborative workspace
Qlik Compose® for Data Warehouses
Automate the entire data warehouse lifecycle
Talend Data Preparation
Identify errors, and apply and share rules across massive datasets
Qlik Enterprise Manager®
Centrally configure, execute, and monitor replication and transformation
Talend Data Catalog
Understand the data flowing through your analytics pipelines
Qlik Gold Client®
Improve data management in your non-production SAP environments
Talend Data Stewardship
Define priorities and track progress on data projects
All Analytics Products
Qlik Cloud Analytics
All the power of Qlik analytics solutions in a cloud-based SaaS deployment.
Qlik Sense® - Client Managed
The on-premises solution for highly regulated industries.
All AI/ML Products
Bring machine learning to your analytics teams
Financial Services
Manufacturing
Consumer Products
Public Sector
Energy Utilities
US Government
Life Sciences
Communications
Product Intelligence
HR & People
Find a partner
Get the help you need to make your data work harder

Global System Integrators
Transform IT services, solution development, and delivery
- Data Integration and Quality Pricing Rapidly deliver trusted data to drive smarter decisions with the right data integration plan.
- Analytics Pricing Deliver better insights and outcomes with the right analytics plan.
- AI/ML Pricing Build and deploy predictive AI apps with a no-code experience.

NASA scientists and data scientists have more in common than you might think. See why — and learn how you can chart your own path to data-driven discovery at Qlik Connect.
Revealing The New Qlik Brand
Hitting the Ground Running with Generative AI
Enter Qlik Staige – Helping customers unleash the full potential of Artificial Intelligence
Artificial Intelligence
Act on insights with AI-powered analytics
Data Management
Collect, store, organize, and maintain data
Bring automated machine learning to analytics teams
Data Products
Solve domain-specific business outcomes
Data Fabric
Data Quality
Discover, manage, enhance, and regulate data
Data Catalog
Find the data you need and evaluate its fitness for your use case
Data Visualization
Make it easier to see trends and relationships in your data
Data Governance
Ensure data is trustworthy and consistent
Integrate applications and data sources
Data Literacy
Read, work with, analyze, and communicate with data
Predictive Analytics
Predict future outcomes based on historical and current data

Domino's Radically Improves Efficiency, Customer Service — and Sales with Real-time Data and Analytics
Urban Outfitters Reduces Store Level Reporting from Hours to Minutes
Data Research Went From Thousands of Hours to Near Real Time at Georgia-Pacific
Decoding Data Products: A Blueprint for Business Success in the Age of AI
Snowflake Summit 2024
The Economic Impact of Cloud Analytics
Customer Stories
More than 40,000 customers find answers with Qlik.
Analyst Reports
Read analyst reports for data integration and analytics.
Whitepapers and eBooks
Visit the Qlik Resource Library.
Visit the Qlik Webinar Library.
Visit the Qlik Video Library.
Datasheets & Brochures
Visit the Qlik Datasheet and Brochure Library.

AI analytics refers to the use of machine learning to automate processes, analyze data, derive insights, and make predictions or recommendations.
Business Intelligence
Data Analytics
Data Mining
Data Warehouse
Predictive Modeling
Community Overview
Welcome to the Qlik Community
Qlik Gallery
Get inspired by recent Qlik apps and discuss impacts with peers
Get support directly from a community of experts
Plot your path of engagement with Qlik
Vote for your favorite product ideas and suggest your own
Training Overview
World-class resources to adopt Qlik products and improve data literacy.
Instructor-Led Learning
Get interactive, hands-on learning with Qlik experts
Free Training
FREE courses and help, from basic to advanced
Literacy Program
Understand, analyze, and use data with confidence.
Self-Paced Learning
Get hundreds of self-paced training courses
Validate Your Skills
Validate knowledge and skills in Qlik products, analytics, and data literacy
- Why Qlik Turn your data into real business outcomes
- Technology Partners and Integrations Extend the value of Qlik data integration and analytics
- Data Integration
- All Products
- By Industry
- Solution Partners
Data Integration and Quality Pricing
Rapidly deliver trusted data to drive smarter decisions with the right data integration plan.
Analytics Pricing
Deliver better insights and outcomes with the right analytics plan.
AI/ML Pricing
Build and deploy predictive AI apps with a no-code experience.
- Topics and Trends
- Resource Library
KPI Examples and Templates
Find the right KPIs for your business. This guide provides examples, templates and practical advice to help you define the key performance indicators that matter most for your organization and teams.

KPI EXAMPLES GUIDE
What is a kpi.
Let’s start with the basics. A key performance indicator (KPI) is a quantifiable measure of performance over time for a specific strategic objective. Business leaders and senior executives use KPIs to judge the effectiveness of their efforts and make better informed decisions.
KPIs vs Metrics
What’s the difference between a KPI and a metric?
KPIs represent how you’re performing against strategic goals. And by goals, we mean specific business outcomes, such as targeted quarterly revenue or targeted new customers per month.
Metrics support KPIs by representing the tactical processes or actions necessary to achieve the KPIs. Metrics track and measure the success against targets for specific actions such as monthly brochure downloads or store visits.
More resources:
Dive deeper on the question, “ What is a KPI? ”
Design your own interactive KPI Dashboard

Don’t just measure. Measure what matters.
Download the KPI Planning Guide to learn:
10 steps to strong KPIs
Which questions help you define your KPIs
170 KPI examples and templates
170 KPI Examples And Templates
In this guide, we’ve identified and prioritized the most impactful key performance indicators examples for each department. Use the table of contents below to find the KPI examples most relevant to your organization and teams.
Project Management
Customer Service
Human Resources
Social Media
Sales KPI Examples
Sales leaders and their teams need to track the key performance indicators that help them close more orders. Below are the 15 essential sales KPI examples:
New Inbound Leads
Lead Response Time
Lead Conversion %
New Qualified Opportunities
Total Pipeline Value
Lead-to-Opportunity %
Opportunity-to-Order %
Average Order Value
Average Sales Cycle Time
Cross-Sell %
Sales Volume by Location
Sales Change (YoY, QoQ. MoM)
Sales Target %
Learn more about Sales Dashboards

KPIs for Managers
Executives and managers need KPIs that reflect their organization’s strategic priorities. Below are the 15 key management KPI examples:
Customer Acquisition Cost
Customer Lifetime Value
Customer Satisfaction Score
Sales Target % (Actual/Forecast)
Sales by Product or Service
Revenue per FTE
Revenue per Customer
Operating Margin
Gross Margin
ROE (Return on Equity)
ROA (Return on Assets)
Current Ratio (Assets/Liabilities)
Debt to Equity Ratio
Working Capital
Employee Satisfaction Rating
Learn more about Executive Dashboards

Project Management KPIs
Project managers need to keep projects on time and on budget while also ensuring a high quality outcome. That’s why the 15 key performance indicators examples below focus on timeliness, budget and quality.
On-Time Completion %
Milestones on Time %
Estimate to Project Completion
Adjustments To Schedule
Planned vs. Actual Hours
Resource Capacity %
Budget Variance (Planned vs Actual)
Budget Iterations
Planned Value
Net Promoter Score
Number of Errors
Customer Complaints
Change Requests
Billable Utilization
Return On Investment (ROI)
Explore dashboard demos

Inspire Action With Your KPIs
10 ways to take your data visualizations to the next level. Learn how to choose the right ones to highlight your KPIs and metrics.
Marketing KPIs
Marketing leaders need to track KPIs which enable them to measure their progress against clearly defined goals. The 15 marketing KPI examples below cover all phases of the customer funnel and can be accurately tracked using modern marketing analytics .
Marketing Qualified Leads (MQLs)
Sales Qualified Leads (SQLs)
Cost per Lead
New Customers
Cost per Acquisition
Upsell & Cross-Sell Rates
Conversion Rates (For Specific Goals)
Social Program ROI (By Platform)
Organic Traffic & Leads
Return on Ad Spend (ROAS)
Total Revenue
Revenue by Product or Service
Customer Lifetime Value (CLV)
Net Promoter Score (NPS)
Learn more about Marketing KPIs and Marketing Dashboards

Operations KPIs
Operations managers need to track KPIs around efficiency, effectiveness and quality as covered in the 15 key performance indicators examples below.
Labor Utilization
Employee Turnover Rate
Employee Absence Rate
Employee Training Rate
ROI of Outsourcing
Labor Materials
Operating Margins
Processes and Procedures Developed
Project Schedule Variance
Order Fulfilment Cycle Time
Delivery In Full On Time Rate
Rework Rate
Learn more about KPI Dashboards

Customer Service KPIs
Service and support teams should focus on KPIs that measure response times. But, like the 15 key performance indicators examples below, they should also have a clear view of the customer base and longer term, preventative KPIs such as employee engagement and knowledge base articles.
Number of Issues (By Type)
First Response Time (FRT)
First Contact Resolution Rate
Average Response Time
Average Resolution Time
Most Active Support Agents
Cost Per Conversation
Customer Satisfaction Score (CSAT)
Positive Customer Reviews
Customer Effort Score
Customer Retention Rate
Support Costs / Revenue Ratio
Knowledge Base Articles
Employee Engagement
Explore more dashboard examples

Finance KPIs
Financial teams have no shortage of ratios and metrics to track. Finance managers and CFO’s should use a financial analytics tool to focus on margin, expense, revenue and cash management as shown in the 15 key finance KPI examples below.
Gross Profit Margin (and %)
Operating Profit Margin (and %)
Net Profit Margin (and %)
Operating Expense Ratio
Working Capital Ratio
Debt-To-Equity Ratio
Quick Ratio (Acid Test)
Current Ratio
Berry Ratio
Return on Assets
Cash Conversion Cycle
Accounts Payable Turnover Ratio
Accounts Receivable Turnover Ratio
Budget Variance
Payroll Headcount Ratio
Learn more about Financial Dashboards

Human Resources KPIs
HR managers are primarily concerned with 3 main areas: workforce management, compensation and recruitment. You can use a people analytics tool to track and analyze the 35 key performance indicators examples below:
Workforce Management KPIs:
Absenteeism rate
ROI of outsourcing
Succession planning rate
Open/closed grievances
Promotion rate
Time to productivity
Successor gap rate
Worker composition by gender, experience, and tenure
Internal mobility
Manager quality index
HR effectiveness
Employee satisfaction rates
Training ROI
Compensation KPIs:
HR functional operating expense rate
Labor cost per FTE
Labor cost revenue percent
Labor cost revenue expense percent
Total benefits as percentage of labor costs
Profit vs. compensation per FTE
Human capital ROI
HR functional cost per employee
Recruitment KPIs:
Quality of hire
Vacancy rate
Turnover rate
Resignation/retirement rate
External hire rate
Time-to-fill
Diversity, experience, and gender hire ratio
Recruiting funnel metrics
Talent import/export ratio
Voluntary turnover rate
Retention rate
Recruiting expense per new hire
Retirement rate forecast
Learn more about HR Dashboards

IT managers should track the on-going stream of support tickets and downtime. They should also track the projects and the team that will proactively reduce the number of these tickets in the future as shown in the top-15 IT KPI examples below.
Total Support Tickets
Open Support Tickets
Ticket Resolution Time
Reopened Tickets
Average Time Between Failures
Average Time to Repair
Server Downtime
Security Related Downtime
Total Projects
Projects on Budget
Critical Bugs
IT Support Employees Per End Users
IT Costs vs Revenue
IT Team Turnover
Social Media KPIs
Social media managers should have KPIs that represent reach, engagement, and conversion to revenue. The 15 social media key performance indicators examples below should be applied both as totals and for each social media platform that your organization is active on.
Social Share of Voice (SSoV)
Total Reach
Total Impressions
Followers or Fans or Subscribers
Audience Growth Rate
Share Rate (Shares or ReTweets)
Interest Rate (Likes, Reactions, Favorites)
Response Rate (Comments, Replies)
Key Post or Hashtag Reach
Link Clicks
Site Traffic From Social (By Platform)
Conversions From Social
Conversion Rate From Social
Revenue From Social
Social Program ROI
Learn more about Marketing Dashboards

How to Define the Right KPIs
Who, what, how. Be clear about who the audience is, what they want, and how they’re going to use the KPIs. This means working with your stakeholders to identify the core KPIs that map directly to their goals and strategy.
Be SMART. This popular acronym stands for Specific, Measurable, Attainable, Realistic, and Time-bound. This is a useful touchstone whenever you’re considering whether a metric should be a key performance indicator. SMART KPI examples are KPIs such as “revenue per region per month” or “new customers per quarter”.
Iterate and evolve. Over time, see how you or your audience are using the set of KPIs and if you find that certain ones aren’t relevant, remove or replace them.
See KPI Dashboards in Action
Full Guide to KPIs: Examples and Templates
Master your KPI-finding skills: learn what KPIs are, use template to come up with the best ones, get inspired by examples from a long list of indicators.
Key Topics:
- Introduction to KPIs – What is a KPI? Why use KPIs?
- Feeding vs. Teaching to Fish – Why standard KPIs don’t work
- KPI Template – 12 steps to a perfect KPI
- KPIs Library – 6 Essential KPIs, List of Standard KPIs
- KPIs Implementation – Owning KPI vs. Tracking KPIs, KPIs Calculation
Frequently Asked Questions
Introduction to kpis.
Let’s start the discussion around KPIs. I believe the buzz word “KPIs” is now everywhere, and some of you might doubt their usefulness:
- For some reason, top managers are not satisfied with “just doing things,” but they want to see some KPIs .
- You might know people who hate KPIs and know how to game the system.
In my opinion:
KPIs done in the right way are not just a helpful business tool but an excellent way to make everyday jobs easier and more transparent .
What is a KPI?
I gave a formal definition of KPI in the previous article. We tracked the path of KPIs from “quantification” to “metric,” “measure” and “indicator.”The problem is that formal definition has nothing to do with business realities.
Our practical definition is the following:
KPI is a quantification of an important business challenge.
This definition explains the nature of a KPI (it is an indicator, a numerical value), and it underlines the importance of the connection between KPI and real business challenges.
Why use KPIs?
Sometimes, we see that organizations sabotage the use of KPIs. They do KPIs formally but don’t benefit from them. Look at the statements below; probably, some of them will sound familiar to you:
We have some KPIs, and we look at them regularly.
Yes, we are tracking our performance! We have a dashboard with some nice charts!
We have found the list of some good KPIs for customer support, and we are now tracking them {but there were no actual changes}.
We have some KPIs, and we look at them once a year .
Yes, we are tracking our performance! We have a dashboard with some nice charts that we use for presentation slides only !
We have found the list of some good KPIs for customer support, and we are now tracking them, but we don’t act on them .
So, what’s wrong with KPIs? And how to do KPIs in the right way?
Intuitive Indicators in SMB
If I had a choice to:1) run a business with bad KPIs
2) run a business using the intuition of my team only
I’d prefer the second choice! Bad KPIs are really harmful and demotivating!
Ask any small business (SMB) owner – how does he or she decide about buying some ads?You will learn that the decision is actually fact-based, and there are probably some hidden indicators implied.
Those intuitive indicators are often much better than those that one can find on the Internet.
Numbers don’t lie
Have a look at this picture. Which line looks longer?That’s a simple demonstration that shows that our perception of things is not the best one (the lines actually have the same length ).
We are not programmed to make precise measurements, and that’s why sometimes our intuition fails and takes us to the wrong conclusions.
We need to measure things!

Indicators help to define things
Let’s get back to the previous illusion example.
- What line were you measuring?
I did not ask you about the length of horizontal lines!
That’s another use of good indicators.
When we define the way to measure something, we actually agree about the meaning of the measured subject.
Are you talking about the abstract idea of “quality” or are you talking about a very specific idea of “number of critical problems found by users within the last 6 months”?
Feeding vs. Teaching to Fish
There is a saying: Give a man a fish, and you feed him for a day. Teach a man to fish, and you feed him for a lifetime.
Applying this idea to the KPIs, I could compare ready-to-use KPIs with a fish , and your skills in finding good indicators with an ability to fish .
- One can pick the ready-to-use KPIs (see the KPIs library below),
- A much better choice would be to learn to find tailor-made KPIs.
I won’t decide for you. Below, you will find the long list of KPIs that you can use to get some inspiration about ways to quantify and track your challenges. If you prefer to master your ability to fish, I would recommend you start with this 12-Step KPI System .

KPI Template: 12 Steps to a Perfect KPI
Here you have a template for your new KPIs. This is an executive version KPI system . The template is divided into:
- Basic Level – with must-have settings for a KPI
- Expert Level – with some ideas to excel your performance indicators
For users of BSC Designer software, I’ve added some explanations about automating discussed ideas with the software.

Basic Level
1. define kpi name.
Avoid mixing together target, time scope, measure units, and KPI name.
For example: “ Increase sales by 15% within 1 year” is not a recommended name. A better approach (my arguments are explained in KPI System ) is to define separately:
- KPI name (“Sales”)
- KPI optimization function (in this case “increase”)
- KPI target and timeline (current sales + 15%)
- KPI measure units (% or $)

2. Align KPI with a Strategic Goal
The worst thing that can happen with KPI is that it will be measured without any particular purpose. Know the business goal behind the indicator.
Why do you measure certain KPI?
- You measure sales because you plan to increase revenue.
- You measure agent response time because you want to improve customer service.
- You measure the number of lines of code because you … hm… is there a good strategic goal behind it or should we better measure the % of returning problems instead? (like we discussed in the article about quality KPIs ).
Strategic word in the title of this paragraph is not just a business jargon. Try to find a goal focused on changing the way you do things, not just on doing what you did before a little bit better. We discussed this before, the difference between strategic and operational goals . Respectively, the best KPIs should be aligned with strategic goals.

3. Define Current Value, Baseline, and Target
What is a current value of the indicator? Do you plan to achieve a certain value or keep the indicator’s value within certain tolerance levels?
You need to normalize the indicator. You need to do it for several reasons:
- Reason 1. We need some reference with which to compare the current indicator value. Customer satisfaction is equal to 70%… it is good or bad? When having reference points (the baseline and the target), we can answer this question.
- Reason 2. We need to put the current value of the KPI on a certain scale to make the indicator comparable with others. Without this, we cannot compare the performance of an indicator measured in “$” with the performance of another indicator measured in “hours.”
Having the baseline and target, we can calculate the performance of the indicator.

4. Define Data Collection Steps
Do you enter the values of the indicator manually? Is it updated from an Excel spreadsheet automatically, via Zapier connector or RESTful API? Do you connect directly to the database?
In the previous step, we defined the baseline and the target. Most likely, these values will be entered manually.What about current value? How do you plan to update it? You need to define a standard procedure that the person responsible for the KPI will follow to update the indicator. The best approach, of course, is to make the update 100% automatic.
We did the basic level. If you have enough resources and political power in your organization, I do recommend that you proceed to the “Expert” level.
Expert Level
5. find leading and lagging indicators.
In the context of your business goal (see Step 2 above), is your KPI leading or lagging? What is its leading (lagging) pair?
Before, we discussed the difference between leading and lagging indicators:
- Leading indicators are related to success factors and help in predicting the achievement of the goal.
- Lagging indicators are related to the results and help to validate the achievements.
The trick is that we often focus too much on just one type (normally the lagging one) and forget about the other.
Do you need a practical example?
Let’s say we measure NPS (Net Promoter Score) that is the lagging indicator in the context of “Improve customer service” goal, but we don’t track anything related to improving NPS. A leading indicator pair for NPS can be product quality or customer service responsiveness.

6. Define the Weight
Define the weight of the indicator compared to other indicators aligned with the same goal.
The weight of the indicator and its calculation were explained in the scorecard calculation article. Define the weight for the goals and indicators to be specific about their relevant importance.A classic example:
- In the context of the “Improve customer service” goal, the “Response time” and “First call resolution rate, %” indicators should be calculated with different weights.
7. Agree on Update Frequency
How often do you plan to update the indicator?

8. Set Expiration Date
Plan to review your indicator regularly. Did the business goal change? Did the cost of measurement increase?
Sometimes, we measure something just because we did it before. Your business strategy changes, respectively, your KPIs should change as well. For example:
A company on a startup stage might be interested in tracking the number of meaningful conversations with their prospective clients (like we discussed in the startup KPIs article ).
An established business will also be tracking interactions with clients, but the toolkit and the metrics will be different, like for example, customer surveys .
9. Calculate the Cost of KPI Tracking
Obviously, the value of measurement should be more than the cost of measurement.

10. Define Rights and Roles
Who has access rights to see this indicator? Who is responsible for data collection? Can this person change historical data? Who is responsible for acting when the indicator goes into the red zone?
Look at the KPIs life-cycle:
- KPI definition
- Data collection
- Data analysis, use, and reporting
- KPI actualization and retirement
Different stakeholders are involved. Decide early on the roles and access rights.
- Decide how transparent you want to be with your team.
Don´t build unnecessary information silos .
In BSC Designer: the administrator of the account can assign access rights on the levels of scorecard or specific indicator. User settings allow limiting access of data input users to the historical data.

11. Declare KPI Use Scenarios
How do you plan using this indicator? For annual performance reporting? For bonus calculation? For self-control?
Declare KPI usage scenario for two reasons:
- Reason 1 (obvious one) : explain how exactly you plan to use the indicator and its findings.
- Reason 2 – achieve a certain trust-level by letting the team know how you are going to use the data obtained and how you are not going to use it.
The most dangerous case is when you use KPIs to calculate bonuses. We discussed before what will most likely happen.
If you don’t plan to align KPIs with bonuses, then make sure you explain clearly to your team how the metrics will be used. Look at the self-appraisal approach promoted by the OKR framework .
- Probably, your team will finally start loving their KPIs.
12. Analyze Expected Behaviour vs. Reality
Compare your initial expectations about the effect of the KPI with how it actually changed the behaviour of your team.
For example:
- You implemented near miss reporting in order to improve quality,
- This “improvement” resulted in fewer incidents being properly reported…
It might happen, so make sure you plan to review behaviour induced by the KPIs to compare reality with expectations.
Found something unexpected? Plan to update your KPIs!

Why Standard KPIs Don’t Work
It’s easy to find a long list of KPIs on the Internet. Here are some reasons why standard KPIs won’t work for you.
KPI is a model of reality, not the reality
Let’s take “unit market share” as an example. In the “ Tim Cook: The Complete Interview ” by Sam Grobart, Apple’s CEO shared his thoughts on measuring success:
“I don’t measure our success in unit market share,” “… We’re not in the junk business.”
Tim Cook’s recipe is to focus on doing the right things.
Most standard KPIs are lagging indicators
In other words, these KPIs are very good at telling the story of what has already happened but don’t help much to improve.
It’s good to know revenue per employee of your business; probably, you can benchmark it to other companies and find out that it is too high, but it doesn’t automatically result in the improvement. You need to:
- Analyze the situation
- Understand the reasons for the challenge that you are facing
- Define success factors
- Quantify them if possible (leading metrics!) and
With standard KPIs, you skip the first three steps, and that’s the reason the action plans based on standard KPIs often fail.
Goals Come First
To finalize the introduction to the KPIs, I’d like to make a simple statement:
Business goals should come first!
KPIs that appear on the scorecard/dashboard should appear there only when you have got a clear idea about the current goals of the organization and how they are connected.The best practice is to create a strategy map first, map your goals, and only then start looking for the ways to measure them. That’s what we have discussed in the Four Perspectives of the Balanced Scorecard
KPIs Library
- Use it to get some inspiration about KPIs and support in some way the discussions around your strategy.
- If you have found some KPI that looks interesting but doesn’t resonate with your goals – skip it .
Here is what you will find here:
6 Essential KPIs
- A Long List of Standard KPIs

Let’s start small.
If you had limited time and resources, what KPIs would you track?
How would you find them? I would recommend looking at these two:
- Look at how things are working now and try to find bottlenecks
- Look at where the money is coming from and what are the success factors of this magic.
That’s basically what we did in the 6 Essential KPIs to Ensure Business Survival article .
What were the results?
- KPI 1. Leads generated. Acquisition numbers.
- KPI 2. Conversion rates. The most critical ones: like conversions from lead to sales; from first-time purchase to return purchase.
- KPI 3: Impressed customers, %. It’s just about customer service; it’s about powering your word of mouth marketing.
- KPI 4: Perceived product/service quality. We discussed what perceived means in the customer perspective of the Balanced Scorecard.
- KPI 5: Team success index. A set of metrics to track the challenges of your team. Can be just one “retention rate,” or you can define success factors and come up with something interesting.
- KPI 6: Financial health index. A set of financial metrics that make sense in your case – can be just two – acquisition cost (CAC) and customer lifetime value (LTV).
In the original article , you will find some more details and explanations.
Standard KPIs
Below, you will find some standard KPIs from different domains. We have compiled the list of these KPIs from different articles published on our website, so if you want to know more about some of them or understand the business context, just follow the “read more” link.
Customer Service KPIs
- Cost per inbound contact
- First-line resolution rate
- Self-service completion rate
- First contact resolution rate
- Average speed of answer
- Satisfaction by the customer service
- Agent training hours
- Agent occupancy
- Agent satisfaction
- Turnover rate among top performers
Learn more in the customer service scorecard example.
Marketing KPIs
- Sales qualified lead (SQL)
- Total Leads
- Marketing qualified lead (MQL)
- Lead to Marketing Qualified Lead (MQL) Ratio
- SQL to Sale
- Cost of Customer Acquisition (COCA)
- Marketing Expense per Employee
- Marketing Expense as a Percentage of Revenue
- ROI by Marketing Channel
- Customer lifetime value (CLV)
- Revenue per Marketing Qualified Lead (MQL)
- Deals closed
- Media mentions
- Owned reach
- Brand awareness
- Website SEO metrics
- Adjusted Bounce Rate
- Email Marketing Metrics
- Cost per lead (CPL)
- MQL to SQL Ratio
- Net promoter score (NPS)
- Returning visitors
- Referrals and reviews
- Customer Retention
Learn more in marketing scorecard example.
Top 5 HR KPIs :
- Staff engagement
- Commitment to talent management
- Quality of leadership
- Adaptability
10 Standard HR KPIs :
- Performance of New Hire in 6 months
- Speed of Hire
- Quality of Hire
- Time To Productivity
- Percentage difference in productivity before and after training
- Percentage of employees that participate in career coaching
- Profit per employee
- Voluntary turnover
- Involuntary turnover
- Involuntary turnover high performers
HR Hire KPIs:
Focused on quality:
- % of employees coming via referral
- Performance level of new hire after 1 year
- Performance level of new hire after 3 years
- % new hires completing probationary period
- % of new hires present after 1 year
Focused on time:
- Cost To Hire
- Time to Hire
- Profitability of new hire
Aligned HR KPIs :
- Time to find required number of qualified candidates
- Yield ratio
- Time reduction achieved, %
- Cost reduction achieved, %
- Return problems rate, %
- Performance improvement, %
- Improved qualification/skills results, %
- High performers turnover, %
- Employee Engagement Index, %
- Talent’s ROI
- Revenue per FTE employee
Shared HR service :
- Hiring costs
- Number of HR admin per head
- Time spent on HR administration
- Case Handling Time
- Employee Satisfaction with Case Management
- % of Cases Solved
- Reduced employee turnover
- Time spent training HR SSC staff
HR during M&A :
- % of mission critical employees retained during the M&A process
- % of mission critical employees retained 6 months after the M&A process
- % of mission critical employees retained 2 years after the process
- Decline in staff engagement during the M&A process
- Decline in productivity during the M&A process
- Time taken to return to pre M&A productivity and engagement levels
- Number of value added roles created during the M&A
- Increase in concentration of exam qualified staff after M&A
- Conversation to lead conversion rate
- Qualified leads close rate
- Conversion rate to sales
- Quantity of leads needed in sales funnel
- Conversion to qualified leads
- Average sales cycle time
- Time to answer a prospect’s query
- Total cost to gain a new customer
- Revenue per sales rep
- Customer lifetime value
- Returning customers, %
Learn more in sales scorecard example.
- IT expense as a percentage of total expense
- IT expense per employee
- Support expense per user
- The number of critical problems reported by user
- Business system use
- Time to register a new account
- Account creation success rate
- Availability (uptime)
- Downtime related to security issue
- Mean Time Between Failures (MTBF)
- Mean Time to Repair (MTTR)
- The number of returning problems
- Restore success rate
Learn more in IT scorecard example.
Innovation KPIs
- Idea generating and capturing budget
- Hypothesis testing budget
- R&D budget
- Revenue from new projects
- Royalty income
- Costs optimized
- Perceived value metric (external clients)
- Perceived value metric (internal clients)
- Innovation pipeline index
- Diversity of ideas sources
- Number of touch points with stakeholders
- The number of improvement points found during the review
- Behavior change metric
- Ideas generated
- Idea to systematic discussion rate, %
- Discussion to hypothesis rate, %
- Hypothesis to tested hypothesis rate, %
- Tested hypothesis to implemented rate, %
- % of employees who passed training for innovation
- Training engagement index, %
- Minimal training exam score rate, %
- Innovation training behavior change index
- Time spent on discussing hypothesis
- Tools and funds availability
Learn more in Innovation scorecard example.
Employee engagement
- Resources and Tools Availability
- % of task with high expertise and involvement
- Number of feedback sent to employee
- Number of recognition received by employee
- % of ideas from employee reviewed in details
Learn more in Employee engagement scorecard example.
KPIs Implementation
Learn more about the best practices in implementing KPIs.
Owning KPI vs. Tracking KPIs
The key component of the successful implementation of the measurement system is a proper performance measurement culture.
What is the best measurement culture like?
- The KPIs are the product of discussion
- The KPIs are not mandated from the top but are organically suggested by your team
- The KPIs help to solve real business problems , not just do routine reporting
- The KPIs are clearly ( unambiguously ) defined
- The KPIs are not perceived as punishment but a way to make things better
How to achieve this? I would recommend checking out this 5-step guide for measurement culture where we discuss the cultural challenges and the ways to address them.
KPI Calculation
Once you have the list of KPIs, you need to do some calculations. These can be basic calculations of the performance score or more advanced calculations of the scorecard. We have discussed the challenge of the KPI and scorecard calculation in this article . Here, you have an executive summary:
1. Define KPIs properly
Define KPI’s values properly: baseline, target, current value.
Don’t mix the idea of target and goal (“improve customer service performance” is the goal and “… by 10%” is the target).
Decide if you need to increase the value (increase profits) of the indicator or decrease it (decrease response time).
2. Normalize KPIs
To make different KPIs comparable, we need to normalize them first. Think about website visitors measured in “visitors/month” and time on site measured in “minutes.” We need to put both indicators on a certain scale to make them comparable. Learn more about metric normalization .
3. Track Performance and Progress
It makes sense to track separately performance and progress . The difference was explained here .
4. Assign weight to KPIs
The weight of KPI shows the relevant importance of the KPI on the scorecard. KPIs with higher weight will contribute more to the total performance.
5. Automation software is a must
Although you can start with a spreadsheet , it would be hard to scale the project without professional tools like BSC Designer.
Learn from other users of BSC Designer.
- We use BSC Designer for establishing Strategy Maps for our company, establishing strategic goals and KPIs on the BSC and trace the KPIs and targets using the software. >
We are using BSC Designer for a continuous reporting of security KPIs and in the future we may use it for all of our management processes. >
- We use BSC Designer to make a synthesis of a dynamic view of KPIs according to Kaplan and Norton Balanced Scorecard (BSC). >
We needed to set goals and KPIs to monitor, evaluate, review, and manage them using a powerful tool. >
BSC Designer is an easy to use tool that makes creating and managing KPIs and strategy maps simple and quick. >
- We use BSC Designer to manage strategic and operational KPIs. These indicators are updated weekly, monthly and yearly. >

Below, you will find some frequently asked questions about KPIs and our answers to those questions. Feel free to ask more questions in the comments at the end of this article.
We are doing fine without any KPIs – do we need some?
It’s like using a GPS in your car. When you drive the route that you are used to driving every day, then most likely you won’t turn a GPS on. Does it mean that you don’t need it in more complex situations? The same can be said about KPIs. The more complex your business environment is, the more you need good KPIs. Above , we have discussed other reasons to use the KPIs.
Does “Implement new HR training program within 1 year” need a KPI?
Let’s look at the goal first. It sounds more like a milestone goal. At the end of the year, one can give a “yes/no” answer to the question of whether the program was implemented or not. The way that the goal is formulated now doesn’t imply an achievement of any performance results, so there is no sense in using key performance indicators. If you would focus on improving the efficiency of HR training programs or reducing the operational costs, then this could be a good performance goal, and respectively, there can be used performance indicators.
What is a good KPI for “Improve employee morale by 15%” goal?
Let’s start with the way this goal is formulated. The goal, in this case, is “improve employee morale,” and “15%” is an improvement target. I would recommend dividing the goal and the measurement/target. The goal, in this case, is to “Improve employee morale.” A morale index might be used as a metric.
What KPI should we use for the “Double employee productivity” goal?
Many companies have such goals on their scorecards in order to motivate their staff. In my opinion, goals like this one have two major flaws: The goal is unrealistic: why exactly do we need to double the productivity; why not increase it by 10% or 30% or by 12.75%? It is not clear how to measure the productivity for tasks like marketing, software development, copywriting…? Having said that, we need to update the goal to something like “Improve employee productivity” and get back to the basics and find proper KPIs .
Do we need software for our scorecard?
You are asking a vendor of such software, but I’ll try to be objective when answering… It depends on how serious you are about KPIs. If you need to maintain KPIs in several perspectives, calculate their performance, take into account their relevant importance, visualize them on strategy maps, then I would go for some professional software like BSC Designer . I know some Excel gurus who can create a real state of the art scorecard, but the question is how hard is to maintain those scorecards? We have analyzed the cons and pros of this approach in a separate article . If you don’t have a budget – start with BSC Designer Freeware , and then upgrading to the professional scorecard tool will be easier in the future.
Is a KPI that I have a “leading” or “lagging” one?
These terms are contextual; one KPI is leading or lagging only in the context of a certain business goal. To understand the difference, have a look at this article .
Can we use KPIs for creative tasks?
Yes, it is possible. For example, we have discussed the KPIs for graphic designer . The article starts with an example of how Salvador Dalí quantified artistic talent. A different question is what quantification is relevant in your case.
What is the correct term: KPI, metric or indicator?
When talking about terminology, there is a difference . It is a good idea to understand this difference and use the correct terms in each case. A practical experience, however, shows that the term “KPI” is used interchangeably. To stay on safe ground, I’d use “metric” or “indicator” as terms.
What KPI template do you recommend?
Actually, none of them. There are some popular industry-standard KPIs. Yes, they look very professional, and they might be a good starting point, especially if your boss just wants you to “find some KPIs.” The problem is that the impact of a few tailor-made KPIs designed by your team for your business goals is much higher than the impact of 50+ KPIs found on the Internet.
It feels like my team doesn’t accept new KPIs… What might be the reason?
Two most typical reasons are: Those KPIs are not aligned with real business problems The KPIs are not the product of the discussion Have a look at the cultural aspect of performance measurement in your organization.
My employee allowed a KPI to move to the red zone. How should I react as a manager?
In my opinion, this situation is a chance to start a discussion about what can be done better in the future. That’s why we have KPIs: to understand our business better and to prevent problems in the early stages.
How do we cascade KPIs across the company?
Actually, we cascade by business goals. We’ve discussed this in detail in this article .
Do you recommend using KPIs for bonus calculation?
If you do it to control your team in a “carrot-and-stick” style, believe me, they are cleverer than you are, and they will find some ways to game the system . We have discussed possible approaches to the reward challenge in a previous article .
What number of KPIs do you recommend having on a scorecard?
Just a few KPIs will survive the proper discussion process. Others will be deleted or moved to the scorecards of the teams or individuals that work specifically on that problem. A good formula to have in mind is 1 business goal = 2 metrics (one leading/predictive and one lagging/result).
If you could give only one bit of advice about KPIs, what would you suggest?
Create and carefully maintain a proper measurement culture in your organization!

BSC Designer is strategy execution software that enhances strategy formulation and execution through tangible KPIs. Our proprietary strategy implementation system reflects our practical experience in the strategy domain.
Leave a Comment
Save my name, email, and website in this browser for the next time I comment.
This site uses Akismet to reduce spam. Learn how your comment data is processed .
Privacy Overview
84 Key Performance Indicators (KPI) Examples (Tips + FREE templates)

You know you need them, but finding the right KPI for you or your business can be difficult. To make things a little easier, we have put together a resource that has different KPI examples for all the departments in your organization, and even KPI examples for different industries.
\While you read through these KPI examples, keep in mind that these are just examples - and we don't recommend simply copying and pasting them into your own strategy.
The best KPIs for your organization start with defining your business objectives and then designing KPIs that measure them . This list is perfect for those who have already defined their business objectives and are looking for some inspiration around ways to measure these objectives.

Here’s what you will discover inside this article:
- Marketing KPIs
- Financial KPIs
- Customer Service KPIs
- Health & Safety KPIs
- Retail KPIs
3 tips to boost your performance
Monitor performance with kpi dashboards in cascade.
- + FREE KPI Example Generator for 20+ industries!
What does KPI stand for?
KPI stands for Key Performance Indicator. A KPI is a measurable value used by an organization to keep track of and determine progress on a specific business objective. KPIs allow organizations to evaluate how well they're performing, and if current behaviors should be continued or if a change of strategy is needed.
Examples of Marketing KPIs
The most obvious example of traffic would be website traffic - but the same applies if you have a physical store front too. How many people are walking past your store (or browsing your e-commerce website) and therefore how many people have a chance to see your products and perhaps become leads.
Example: # of website visitors per day
Traffic to Lead Ratio
A logical extension of measuring traffic is to measure how much of that traffic actually converts into leads. You'll need to define what a 'lead' means to you - is it a free trial, or a conversation with a sales clerk?
Example: % of the traffic which starts a free trial
Cost per Lead
How efficient is your marketing campaign? Once you have traffic converting into leads, it's time to measure how much each of these leads is costing you (you'll then compare this number with one of your sales KPIs around value per sale).
You can use many different tools to track this important KPI, such as Google Adwords, Google Analytics, and SEM Rush. Alternatively, you can use one source of truth to pull data from all different sources into one place. Using Cascade, you can build customizable KPI reports and track all important metrics in real-time.
Qualified Leads
Marketing teams consider this to be one of their most important metrics. You can use it to determine the quality of the leads you generated through your lead generation activities.
This KPI is usually broken down into 2 categories:
- Marketing Qualified Leads (MQLs)
- Sales Qualified Leads (SQLs)
Click-Through-Rate (CTR)
Marketers use this KPI to measure engagement across channels with their content.
The formula for calculating click-through-rate is very simple:
(Total clicks / Total Impressions) x 100 = CTR
For example: If your LinkedIn ad had 17 clicks and 2253 impressions, then your CTR would be 0,75%.
Customer Acquisition Cost (CAC)
CAC is another key marketing and sales growth KPI you should track. It measures how much your company spends to acquire new customers.
Potential investors will consider this KPI and Customer Lifetime Value as one of the most important things. They will evaluate the ratio between them and LTV should always exceed CAC.
Here’s how to calculate CAC:
Total Sales & Marketing Spend / Number of New Customers Added
Net Promoter Score (NPS)
You could certainly argue that your NPS isn't a marketing KPI. Your NPS measures how likely your customers are to refer a friend or colleague to your product.
It would be remiss of us to ignore existing customers, given their importance as a marketing channel for gaining new customers. The NPS is calculated by asking customers how likely they are to recommend your product on a scale of 1 to 10.
NPS is usually time-bound, so typically you would look at your NPS for the past 30 days, rather than the total from the beginning of time to ensure that the KPI remains relevant.
We measure our NPS score at Cascade using a system called Delighted and then synchronize the data back to one of our marketing dashboards built in the Cascade Strategy software.
Page Conversion Rate
When it comes to websites, everything is ultimately about conversions. Getting people to start a free trial, buy a product or sign up for a demo.
Measuring conversion rates as a percentage is the best way for you to determine what pages are most effective at getting people to convert.
As a result, you will be able to determine which pages need more focus on conversion rate optimization. In addition, you can identify what makes conversions successful and apply those techniques to other important pages.
Example: A percentage of the total visitors to the page that converts.
Time On-Site
If people are spending just a few seconds on your site before clicking the back button, you're likely doing something wrong. They're certainly not converting if they end up heading back to the Google search results page within a few seconds of clicking on a link to your site.
New User to Returning User Ratio
Every visit to your site is not equal. When you start diving into your conversion rates, you'll likely notice that returning users (people who've been to your site before) have a much higher conversion rate than new users.
That's because they've made a conscious effort to return to your site and are interested in what you're doing. Measuring and increasing this ratio is key to driving healthy site conversion rates.
👉 Visualize your Marketing KPIs in our Free Marketing Strategy Template!
Examples of Financial KPIs
Gross profit margin.
Expresses your profits as a percentage of total sales revenues generated. This gives you a high-level view of how much profit you're making.
Although, it doesn't factor in all expenses so shouldn't be used for detailed decision-making. It is however useful for bench-marking your performance over time or comparing your profitability to another similar company.
Net Profit Margin
The percentage of revenue remaining after operating expenses, interest and taxes have been deducted from a company's total revenue.
This gives a more accurate internal figure for understanding profit, but is less useful for comparisons outside of your company.
Monthly Recurring Revenue (MRR)
Monthly Recurring Revenue is a popular metric for SaaS companies such as ourselves. This metric looks only at the revenue you generate each month which will re-occur with little to no additional investment.
For example, any customer who signs up for a recurring monthly subscription to Cascade increases our MRR.
Return on Equity (ROE)
ROE measures your net income against each unit of shareholder equity. Return on equity ratio not only provides a measure of your organization’s profitability but also its efficiency. Less useful for startups, but an important KPI for established organizations.
Current Ratio
The Current Ratio KPI weights your assets. Assets such as accounts receivables are weighted against your current liabilities, including accounts payable. This will help you understand the solvency of your business.
Operating Cash Flow (OCF)
This is one of the basic financial KPIs that every CFO has to be aware of. It tells you how much revenue is your company generating from its daily operations. In short, it reveals the short-term financial health of a company.
Revenue per FTE
Employee costs usually make up the bulk of a company's expenses. So, it's often useful to measure how much revenue you are actually generating for each employee in your company.
This gives you an idea of whether you're making an appropriate amount of revenue for the size of your business.
Revenue per Customer
This is a quantifiable measure that gives you an idea of how much gross revenue you make per customer. How you calculate this will vary depending on the type of business.
For us as a SaaS business, we look at the Life Time Value of a customer (LTV) based on what they pay in their subscription and how long a subscription typically lasts. If you were coffee shop you might instead look at the average spend in a visit.
Revenue Growth Rate
This KPI helps to ensure your business continues to grow at a target rate, measured by a percentage. Ideally, you would measure this monthly or on a 12-month rolling average basis.
👉 Visualize your Finance KPIs in our Free Finance Strategy Template!
📚 Recommended read: 10 Popular KPI Software Tools To Connect & Visualize Your Data (2023 Guide)
Examples of Sales KPIs
A simple count of the number of leads that your salespeople are working on each month. Start by setting a target for the month (say 100 leads). Then break this down into the areas you want the leads to come from (outbound, inbound, free-trials, etc).
Qualified Opportunity Rate
So you've got leads coming in, but are they quality leads that can actually result in sales? Measure what percentage of your leads moved through your sales pipeline into a qualified stage. CRM systems like Pipedrive have this percentage built into their reporting.
Opportunity to Win Ratio
The ultimate test of whether your opportunity pipeline is working - what percentage of all new opportunities ultimately turn into sales. You should measure this at an overall level for your sales team, but also by an individual salesperson as this is the acid-test of their performance.
Total Sales Volume
We'll keep things super simple to start - you need to be measuring the total volume in $ sold by your sales team on a minimum of a monthly basis. Ideally, you'll set a constantly growing target, but don't forget to factor in seasonal changes such as around Christmas or the holidays.
Discounts Applied / Margin Retained
Selling is one thing, but it's easy if all your sales team is doing is applying heavy price discounts to get sales over the line.
At the end of each month, take the total sales volume, and calculate it as a percentage of the total sales volume if all sales had been made at full price. Measure this regularly and ensure you're not on a trend that is driving higher and higher discounts just to hit the volume targets.
Sales Cycle Length
One of the things that hurts sales teams isn't so much the lack of sales, but rather that the sales cycles are simply too long. That makes targets hard to reach quickly and gives you less room to course-correct if sales start to take a downturn.
Use your CRM system to measure the average time between a lead becoming an opportunity, and when they close to becoming a sale - the shorter the better.
Average Retention Rate
This might look a little different depending on your business. Essentially we're looking to measure churn/retention after the sales cycle is completed. A low retention rate is often an indicator of problems in the sales process (in the worst case, it could even be due to misselling ).
Measure what percentage of your customers cancel each year/month (or whatever is most appropriate for your business).
Sales Cost to Sales Volume Ratio
The cost of making a sale is often higher than you think when you factor in lead costs, salaries, commissions, fixed building costs and more. Understanding your sales cost to sales volume ratio helps you make informed decisions about whether (and how) to grow your sales team efficiently.
Measure the total cost of your sales efforts in a month vs the total sales volume generated in that month (or factor your sales cycle time into the formula for a more accurate view). Then convert that to a ratio and express it as a percentage.
👉 Visualize your Sales KPIs in our Free Sales Strategy Plan Template!
Examples of Customer Service KPIs
Number of support tickets & complaints.
Customer service teams need to measure the number of new issues/support tickets/complaints being generated every day, week, and month.
This allows you to understand if these new issues correlate to any new business developments such as new product launches. If the number of new issues spikes up, you might need to investigate and resolve the root cause.
Customer Satisfaction Score
A customer service department needs to keep track of your customer satisfaction (CSAT) score. This KPI measures the performance of your customer service department.
You can achieve this by issuing a mini-survey to your customers after they have completed an experience with your service. You need to take it seriously and don’t rely on email feedback alone as your survey mechanism
First Contact Resolution (FCR)
FCR is a good KPI to measure the percentage of support issues resolved by the customer service department upon first contact with a customer. For web chats or live calls, this means your agent resolved the issue before the customer ended the chat session or hung up the phone.
FCR is calculated by dividing the number of issues resolved on first contact by the total number of customer contacts with the department. Issues are deemed “resolved” if the customer says they are resolved.
As a result of this information, you can narrow down to issues that aren’t being resolved on the first contact and address the root cause.
Abandon Rate of Calls & Chats
Analyzing the abandonment rate can help customer service departments decide what measures need to be taken to address the issue. Consequently, the CS department may agree that ring-backs should be implemented where a customer has an option to request a call back after holding on to a queue.
Additionally, abandon rates can help you optimize resources such as utilizing staff from other departments during peak hours.
Average Resolution Time
This is a common performance measure for customer service. Great customer service is synonymous with a real-time resolution of issues. Therefore, if your department responds to customer queries faster, they will be happier with your services and will be more likely to stick around for long.
If the department is unable to keep the resolution time low, it might be an indication that your team is understaffed.
Training Investment per Employee
Whilst this is very much a lead indicator, you should closely monitor how much you're investing in training and development.
If you invest too little, likely, you'll either (a) struggle to develop top talent internally or (b) have top talent leave to pursue training and development opportunities elsewhere.
Wait Time for Callers
Having to wait in queues for endless minutes can be quite frustrating. Therefore, organizations should ensure the average call wait time for support is within an acceptable range.
Calculate this customer service KPI by dividing the total time customers wait in call queues by the total number of customer calls answered.
👉 Visualize your Customer Service KPIs in our Free Customer Service Plan Template!
Examples of IT KPIs
Project delivery time.
This is one of the common KPIs that IT teams get measured on by the wider business: Did they deliver what they promised on time?
It is relatively easy to measure if you are managing projects within a time frame and clear targets (weekly, monthly, quarterly, yearly). Slight delays in any process in the organization are likely to cost you time in the end.
Quality Assurance
One thing is to deliver a project on time, but if it is riddled with issues and bugs, this means very little.
The number of issues per project can be used to identify where challenges may arise during launch, and over time, this will improve the process and reduce friction.
Example: # of issues per project
Service Level Agreements (SLAs)
This is quite a specific way to measure and present both performance (time) and quality. The numbers are agreed upon and measured monthly or quarterly to identify if the agreed level of service is being delivered.
Consequently, SLAs often get a bad rap because they often show an IT team is not as good as hoped. On the flip side, they can present transparency and set realistic expectations if used positively.
Showback (Chargeback)
A common approach from IT departments is to provide ‘chargebacks’ to other departments for rendered services. This demonstrates the value IT brings, but it is often met with resentment.
By switching to ‘showback’ IT teams can measure and report the resources allocated to each department, maintaining the awareness. Measuring where resources are allocated can really help IT identify areas of weakness or stress.
Application And Service Of Total Cost
This metric helps to understand what it costs to deliver each IT offering. For example, how much do you spend on storage, networks, security, and which departments use these offerings the most?
This can help uncover the ‘long-tail’ application run cost, while also aligning the expenses with business goals.
Employee engagement and satisfaction
Although new and exciting projects are great, IT teams spend most of their day helping other employees and customers with the less sexy tasks (“I forgot my password again”).
For that reason, it’s important to measure the level of engagement from employees and maintain focus on the overall strategy. You can measure this through surveys (eNPS - see HR KPIs).
Team initiative(s)
This is almost a direct result of the level of engagement from the IT team. Highly engaged teams are more likely to come up with new initiatives and/or new ways of solving current challenges.
Measuring internal initiatives will not only give you an indication of the level of engagement, but also readiness. As in the readiness to tackle unexpected turns in an agile environment.
👉 Visualize your IT KPIs in our Free IT Strategy Template!
Examples of Human Resources KPIs
You've almost certainly heard of NPS or Net Promoter Score. It's how we measure how likely a customer is to recommend our product or service to someone else. Well, eNPS is a simple but effective take on the same principle. Simply modify the question to suit employees, and measure it in the same way as described here .
Absenteeism
High rates of absenteeism can be indicative of major problems with your culture. Whilst individual employees may have legitimate reasons for absence, you need to closely monitor the blended overall trend of absenteeism.
This is especially so as your organization grows.
The formula:
(Total lost workdays due to absence) / (Number of available workdays) = (Absenteeism rate)
Turnover Rate of High Performers
Culture is important for everyone in the organization. High-performers are arguably the most sensitive to whether or not your culture is effective.
That's because they tend to have a plethora of employment options, and can look beyond hygiene factors such as money alone.
If your top performers are leaving, either you're not paying enough, OR you have a major problem with your organizational culture.
Internal to External Hiring Ratio
Hiring internally is almost always preferable to hiring externally. It's more cost-effective, a great way to retain talent and inspires others to build their careers at your organization.
It's also reflective of the effectiveness of your training programs and talent management capabilities. Simply measure, of the hires in the last 12 months (rolling), what was the ratio of (internal hires: external hires).
% of 'Cherish & Retain' Employees
If you're using a performance management platform, you'll be measuring employee performance but also their future potential for the organization. One of the most useful tools here is the 9-Box Talent Grid.
This grid helps you measure those two dimensions of employee success fairly and consistently. Implement the 9-Box Talent Grid, and measure how many employees fall into the 'Cherish & Retain' group each year.
Employee satisfaction index (ESI)
This KPI shouldn’t be ignored. Especially in these times when everyone is fighting to retain their top talent and attract new staff.
Employee satisfaction index helps you to evaluate how happy or content are your employees with their work.
As with eNPS, you can use the employee satisfaction index (ESI) to track progress over time, compare your performance with other companies in your industry, and determine what events impacted scores at your company.
Revenue per Employee
This is a stat that almost all of the investors I've spoken to have said is important when they look at which companies to invest in. Whilst not a precise science, the revenue per employee (total revenue / total employees) is a good indicator of how efficient your overall organization is.
Payroll is usually the biggest cost on the P&L. Organizations with a low revenue per employee rate don't tend to survive long. The key is to benchmark within your industry, as there is no 'right' answer for what this should look like overall.
3-Month Failure Rate
Most organizations have probation periods in their contracts with employees. But this doesn't protect you from the damage that a bad hire can cause.
The amount of wasted money, time and energy that goes into bad hires (who don't make it through their probation) is a huge driver of overall efficiency. Measure how many employees failed before the 3-month mark, and try to manage this to be as low as possible.
👉 Visualize your HR KPIs in our Free HR Strategy Template!
Examples of Health & Safety KPIs
Number of reported accidents & incidents.
This ‘lagging indicator’ is a pretty obvious one, but it really gives a high-level benchmark to the organization in terms of knowing if safety is improving or worsening.
In addition to monitoring the number of accidents/incidents, you'll probably also want to convert this number to a ratio per employee - i.e. 0.001 accidents per employee. Keep an extra close eye on this Health & Safety KPI during times of change - new processes, new machines, etc.
Lost Time Injury Frequency Rate
This refers to the number of lost-time injuries that happen per million hours worked. So a 'LTIFR' of 8, would mean that 8 lost time injuries take place every million hours worked.
To work out the LTIFR you multiply the number of lost-time injuries by 1,000,000 then divide that number by the total number of hours worked in an organization. So if you have 8 lost-time injuries and 3 million hours worked, your LTIFR is 2.6.
Lost Time Injury Incidence Rate
This measures the events that occur over a standard period of time by a standard number of people. So if we want to calculate the 'LTIIR' (Lost Time Injury Incidence Rate) for 1,000 people, we multiply the number of incidents by 100, then divide it by the number of people.
So let’s say we have 3 incidents. 3 x 100 = 300. Divide that by the number of people and we get a LTIIR of 0.3. So for every 100 people, an organization would have 0.3 LTIs.
Employee Perception of Management Commitment
This KPI for Health and Safety is usually measured through regular surveys. These allow an organization to understand if employees feel that what they do daily and the management objectives are on the same path.
People tend to follow procedures and instructions better if they see a connection between what they do and the big picture. It’s a little like running an NPS for employees.
Average Overtime Hours Per Person
This average is a great KPI to help measure the average time worked by someone beyond their normal working hours. The idea is that if you keep this number low, it can mean that an organization is successfully managing workload and reducing the chance of fatigue in the workplace.
You do want to be careful with this KPI, as it does not apply to all types of organizations and the definition of ‘overtime’ will vary per organization.
Monthly Health and Safety Prevention Costs
This is the expenditure that will be aimed at minimizing health and safety hazards within an organization. It will include training, inspections, and audits that will be aimed at offering conducive and safe working conditions.
Productive Days %
This is a nice twist on the more negative approach of measuring sick days and time off due to accidents. It flips those KPIs into a more positive approach of celebrating the number of days of productive work that were successfully delivered.
You can do this by using productive days as a percentage of the total available working time. For example, if your organization had 10 employees and there were only 5 days lost due to health and safety issues, your Productive Days % would be 99.86% ((3645 days / 3650 available days) x 100 = 99.86%).
% of Management Trained in Health & Safety
This simple leading indicator will help you avoid many of the accidents and incidents that might otherwise occur. It also helps you to understand the effectiveness of your training programs. It's up to you to define what that health and safety look like.
But, once you have, it's as simple as measuring how many managers have undergone it and expressed as a percentage. You can do the same thing for all employees if you want to.
👉 Visualize your Health & Safety KPIs in our Free Health & Safety Strategy Template!
Examples of Retail KPIs
Sales per square foot.
Retail business owners with a physical sales area put a lot of effort into product presentation. This can influence the customer’s purchase decision, which is why it is a good idea to track sales per square foot.
You can calculate this by dividing your net sales by the sales space. This will give you a clear idea of how much it costs to maintain your retail space and the amount of revenue that space generates.
KPI Example: Increase sales per square foot by 20% by 31/08/2023
Conversion Rate
Every customer that steps through your door or hits your site costs some money and has the potential to contribute to your revenue. It is important to keep track of how many visits convert to sales.
You can determine this by dividing the total number of sales by the number of visitors. This gives you an insight into the efficacy of your sales process.
KPI Example: Increase conversion rate to 5% by 30/06/2023
These are the key performance indicators under the Sales category. If you keep track of actual sales, you know how much revenue is flowing in and can make business decisions accordingly.
Foot Traffic
This tracks how many people walk into your store. Foot traffic also helps you determine if particular locations, ad campaigns, or products are successful.
For example, if you open a branch in a different location and don’t get as much traffic as other locations do, it might not be the best place for your business. Foot traffic provides a lot of information regarding customer behavior and response.
This article does a great job of walking you through foot traffic and the various ways to measure it.
KPI Example: Increase daily foot traffic to 150 by 31/03/2023
Customer Satisfaction
This metric correlates with retention since the level of service and/or quality of goods sold will have a direct effect on retention and foot traffic.
This can be measured with NPS score and/or regular surveys delivered to the customers after the transaction ( we've covered NPS in this article ). You can also look at your website analytics to gain a good insight into customer behavior.
You can track things like bounce rates, dwell times, and other similar factors on the platform.
NPS example: On a scale of 0 to 10, how likely is it that you would recommend our company, product, or service to a friend or colleague?
KPI Example: Increase NPS by 15 by 30/09/2023
Inventory Turnover
You can determine inventory turnover by using this formula – the cost of goods sold/average inventory.
This will give you a clear idea of how much stock is used up in a given period. If this figure is too low, you’re not selling enough of the inventory and are at risk of overstocking or deadstock. If this figure is too high, you may be selling out because you aren’t stocking enough products.
KPI Example: Decrease inventory turnover by 5 days by 31/12/2023
Sell-Through
When you divide the number of units sold by the starting inventory and multiply that by 100, you get the sell-through percentage. This gives you an indication of how much of your inventory is being sold compared to how much you purchased.
It will also help you understand which products are performing well and which ones may need further consideration.
KPI Example: Increase the sell-through rate by 15% by 30/06/2023
Year Over Year Growth
Business owners want sustained growth over time. They want their venture to bring in more customers and increased revenue each year. Comparing the current year’s performance with the previous year’s records can help provide some insight.
If you see a downward trend in growth, you may need some remedial action to put the business back on the right track.
KPI example: Increase year over year growth by 10% by 31/10/2023
Gross and Net Profit
Gross profit tells a business owner how much money they’ve earned after deducting product creation and sales costs. Net profit is the profit earned after all business expenses are accounted for.
Both of them provide insight into your expenses and earnings. The data from these metrics can help you channel your resources, plan cost cuts, and introduce business strategies accordingly.
KPI example: Increase net profit by 16% by 31/12/2023
👉 Visualize your Retail KPIs in our Free Retail Strategy Template!
📚 More related resources with KPI examples: Key Operational KPIs and Metrics to Track in 2023 (+ Template) 21 Healthcare KPIs You Should Be Tracking (With Template)
Performance optimization is more than setting KPIs and forgetting about them as you close the spreadsheet.
Here are 3 things you can do to boost your performance:
1. Schedule regular reviews
Don't be one of those teams that set KPIs only to revisit them three times a year to wonder where they missed their targets. Integrate KPIs into your culture and schedule regular reviews to signal their importance. This will help you and your team to identify underperforming areas before it’s too late to pivot.
2. Assign ownership
It's every manager's nightmare to deal with a lack of accountability. The last thing you want to do is be a babysitter and waste your time asking around about who is responsible for what.
Define clear metrics and assign the owner.
Your team members will have a clear understanding of how their daily actions contribute to overall success. They will understand the expectations and focus on achieving them.
3. Connect all data in one place
Several outdated spreadsheets, everyone tracks data on different platforms, and there are tons of meetings to keep everyone aligned.
Across organizations, that's the standard way to measure performance.
Instead of focusing on the actual work that drives businesses closer to their strategic goals, teams spend hours putting data together. Not to mention all the errors caused by manual processing.
As an alternative, you can connect and track all data in one place without having to switch between multiple tools. For example, at Cascade , we provide real-time KPI tracking with automated updates so you can easily access all relevant data with just a click of a button.
There are at least 84 KPIs you can monitor in your business. But if you're going to track any at all and actually learn from the data, you can't do it with a spreadsheet.
The easiest and quickest way to track all KPIs is to organize them in one place with Cascade dashboards.

Build your KPI reports with a drag and drop builder and track all important KPIs in one place.
You will be able to track and measure progress in real-time by adding the right KPIs to your strategic objectives - so you and your team can stay focused on what matters for success.
On top of that, you can connect your favorite business tools with 1000+integrations to manage everything in one place. Cascade will automatically update your key KPIs so you can focus on driving results.
From there, Cascade will help you to build powerful dashboards with all data in one place and context around it.
Imagine no more wasting time and ping-ponging between multiple data sources to put together a progress report.
So, are you ready to boost your performance? Sign up for Cascade for free and start improving your performance and progress towards strategic goals .
Popular articles

Viva Goals Vs. Cascade: Goal Management Vs. Strategy Execution

What Is A Maturity Model? Overview, Examples + Free Assessment
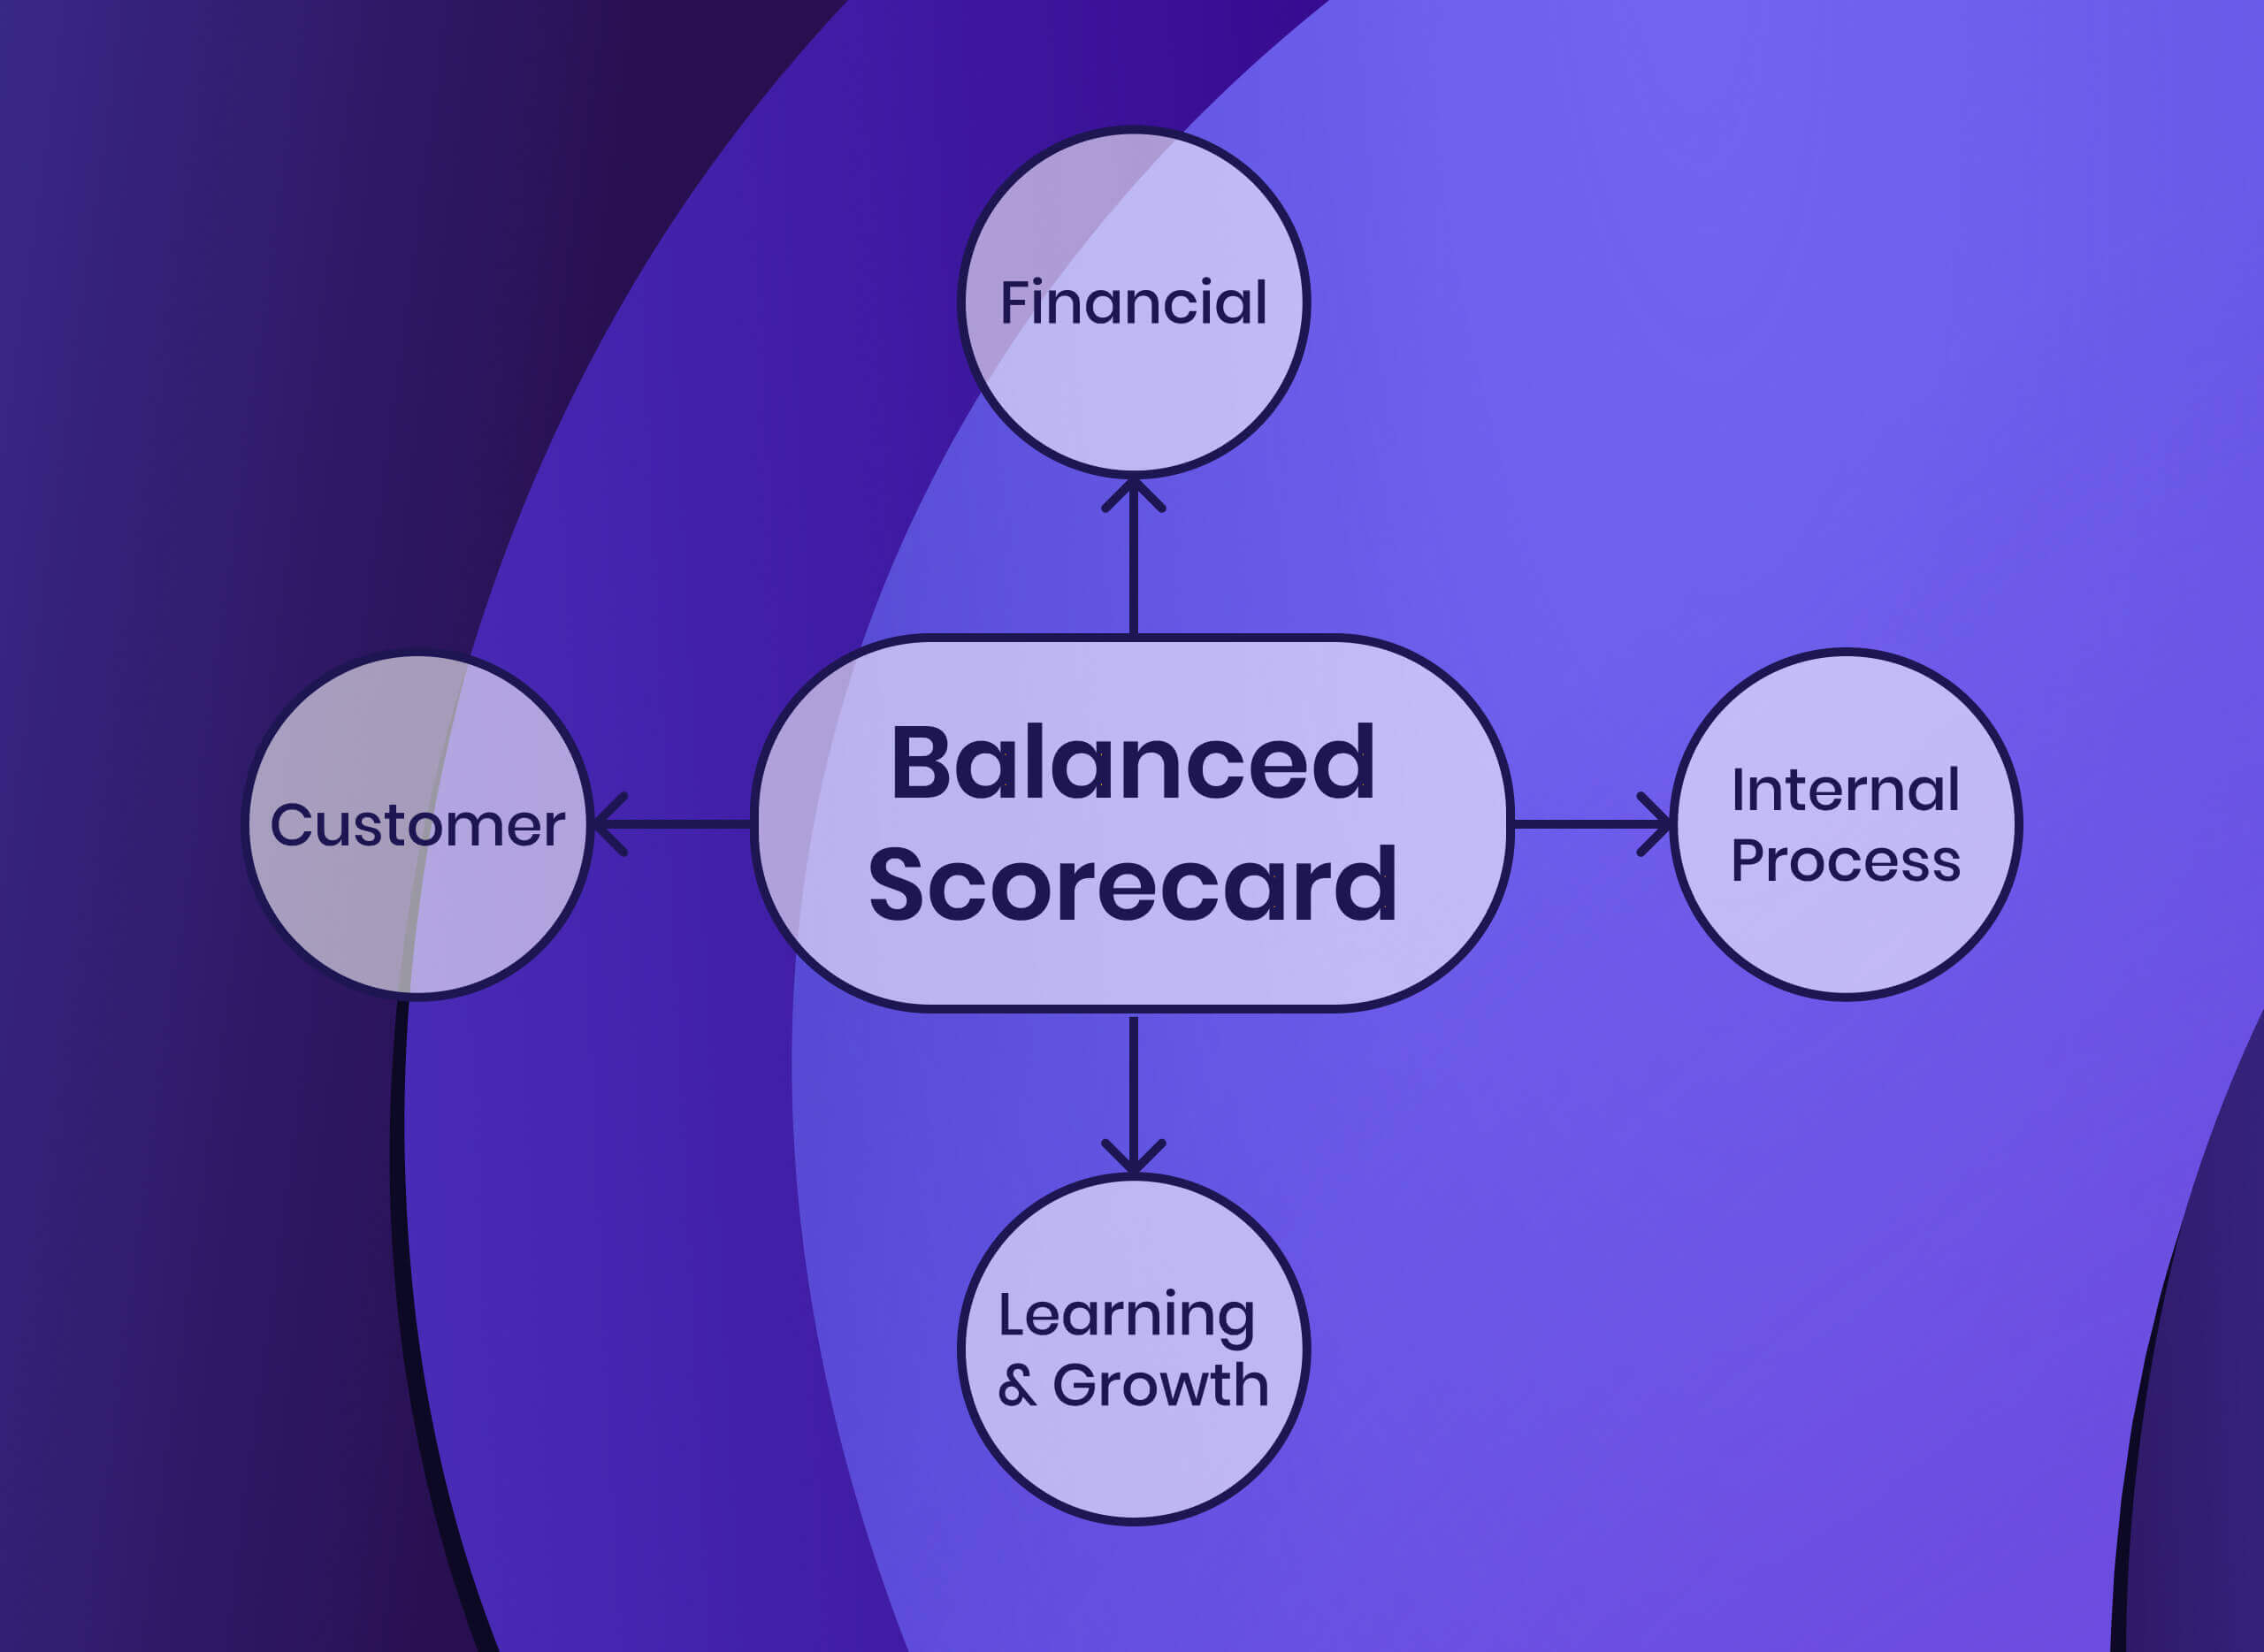
How To Implement The Balanced Scorecard Framework (With Examples)

The Best Management Reporting Software For Strategy Officers (2024 Guide)
Your toolkit for strategy success.

- Product overview
- All features
- App integrations
CAPABILITIES
- project icon Project management
- Project views
- Custom fields
- Status updates
- goal icon Goals and reporting
- Reporting dashboards
- workflow icon Workflows and automation
- portfolio icon Resource management
- Time tracking
- my-task icon Admin and security
- Admin console
- asana-intelligence icon Asana Intelligence
- list icon Personal
- premium icon Starter
- briefcase icon Advanced
- Goal management
- Organizational planning
- Campaign management
- Creative production
- Marketing strategic planning
- Request tracking
- Resource planning
- Project intake
- View all uses arrow-right icon
- Project plans
- Team goals & objectives
- Team continuity
- Meeting agenda
- View all templates arrow-right icon
- Work management resources Discover best practices, watch webinars, get insights
- What's new Learn about the latest and greatest from Asana
- Customer stories See how the world's best organizations drive work innovation with Asana
- Help Center Get lots of tips, tricks, and advice to get the most from Asana
- Asana Academy Sign up for interactive courses and webinars to learn Asana
- Developers Learn more about building apps on the Asana platform
- Community programs Connect with and learn from Asana customers around the world
- Events Find out about upcoming events near you
- Partners Learn more about our partner programs
- Support Need help? Contact the Asana support team
- Asana for nonprofits Get more information on our nonprofit discount program, and apply.
Featured Reads

- The ABCs of KPIs: Defining Key Performa ...
The ABCs of KPIs: Defining Key Performance Indicators

KPIs, or key performance indicators, are metrics that measure the progress of a specific project toward your defined goals. KPIs need to be quantifiable and relevant, and should provide concrete evidence to make project decisions going forward.
A key performance indicator (KPI) is a quantitative metric of how your team or organization is progressing toward important business objectives. Organizations use KPIs at multiple levels—you can set an organization-wide, team-specific, or even individual KPIs, depending on which metrics you want to track. A good KPI can give you a sense of whether you’re on track to achieve your strategic goals.
If this is your first time choosing key performance indicators, this article will walk you through how KPIs differ from other goal-setting methodologies, how to identify key metrics for your KPIs, and how to choose great key performance indicators.
What are KPIs?
Every project will have a list of KPIs that you can track. A social media manager could measure impressions, shares, likes, follows, replies, mentions, and comments, but they shouldn’t try to track all of the KPIs available to them. Tracking every KPI available is like highlighting every sentence in a textbook—it defeats the purpose, since the important things get buried in the clutter of less useful information. After you’ve set your goal, you’ll want to select three to five KPIs that will be most effective in measuring progress.
Why are key performance indicators important?
Key performance indicators are important because they keep teams focused on what matters most to an organization's success. They act like a report card showing how well a team is doing in key areas, which helps everyone understand where they stand. If things are going well, you keep going. If not, you know it's time to change things up.
For example, a customer service team might use KPIs to track how fast they respond to support tickets. By setting a target response time and monitoring their actual performance, they might find that quick responses lead to happier customers. With this insight, they could focus on improving response times and, as a result, see better customer satisfaction scores. This kind of focus can really make a difference in how a team performs.
Types of KPIs
When it comes to measuring success, not all key performance indicators are the same. Each type of KPI plays a unique role in how it sheds light on performance and success. Understanding the differences will help any organization use key performance indicators effectively.
Quantitative indicators
Quantitative indicators are the hard numbers. They are measurable and can be expressed in figures. Think of them as numerical evidence of performance. For example, a common quantitative KPI is monthly sales revenue. It's a straightforward metric that shows exactly how much money was brought in from sales in a month. A sales team might use other similar indicators to help paint a more complete portrait of its operations.
Monthly sales growth: Measures the month-over-month percentage increase in sales.
Average profit margin: Calculates the average profit made from each sale.
Annual recurring revenue: The predictable revenue generated each year, which is especially relevant for businesses with subscription models.
Revenue per customer: Shows the average revenue earned from each customer, which can help in understanding customer value.
Qualitative indicators
Qualitative indicators are more about the quality of something and are often subjective. They're not always represented by numbers, and sometimes they're captured through observations, surveys, and feedback.
A good example is customer satisfaction. This can be measured through customer surveys asking how happy people are with your service, giving you a qualitative view of how you're doing. Here are a few KPIs that also show how customers view a brand:
Brand reputation: Measures how likely customers are to recommend your brand, gained through customer reviews or social media sentiment analysis.
Customer satisfaction index: This can be derived from surveys that ask customers to rate their satisfaction with your products or services.
Customer complaints and resolution rates: Tracks the number of complaints received and how effectively they are resolved.
Customer loyalty and retention rates: Measure how often customers return to make additional purchases and how long they stay with the brand.
Leading indicators
Leading indicators are a bit like a weather forecast for your business—they give you a heads-up on future performance. They can predict changes and trends before they happen, allowing companies to adjust their strategies proactively.
For example, let’s say you’re choosing KPIs for a blog marketing project. Some leading KPIs you might consider include:
Number of relevant keywords per post
Number of hours logged per asset created
Number of links within each post to other content on your site
Number of links to each post from other content on your site
These are all metrics that can predict how each post will perform. Articles that hit your minimum number of relevant keywords and link to and from other content on the site are more likely to be successful. On the other hand, a design asset that only took half the normal amount of time to create is likely to be below average quality and not perform as well as a result. Leading KPIs provide guidance ahead of time that maximize the project's likelihood of success after it's published.
Lagging indicators
Lagging indicators confirm what has already happened. They’re like looking in the rearview mirror to understand past performance. They can be financial, such as quarterly profits, which tell you how much money was made after all sales are done and expenses are paid.
When choosing your KPIs, you should make sure you have a good balance between leading and lagging indicators. For that same blog marketing campaign above, some lagging KPIs you might consider include:
Search engine rankings
Traffic to each post
Value of traffic to each post
Bounce rate (how quickly readers leave your site)
Conversions (how many readers end up purchasing your product)
These KPIs measure metrics that come after the post is published—or, put another way, they “lag” behind the project’s launch. Whereas leading KPIs help predict likely success, lagging KPIs measure actual success. Comparing the data from each will give you information about how accurate your predictions were and why actual performance may have deviated from predicted performance.
![[inline illustration] Leading indicators vs. lagging indicators (infographic)](https://assets.asana.biz/transform/69fb808a-7207-4102-b969-48124b1a489f/inline-goals-what-are-kpls-1-2x?io=transform:fill,width:2560&format=webp "how to write a kpi proposal")
What makes a good KPI?
There are a ton of KPI options for almost every project, but not every measurable metric is a high-quality KPI. For example, tracking the number of words per post in your blog campaign wouldn’t be very useful, since the “best” post length for an article changes from topic to topic.
Similarly, some KPIs are great in one context but not in another. For example, financial KPIs, like labor cost per design project, are very helpful to the accounting department, but not very useful for design managers.
A good KPI:
Is quantifiable
Provides evidence of progress (or lack thereof)
Tracks something that is responsive to changes
Offers useful data for decision-making
Tracks something you can control and influence
Is easy to understand and work with
Can be reliably verified
How to set up effective KPIs
Choosing the best KPIs for the job is a process with specific (but simple!) steps. Follow these four steps to get started.
1. Define your business objective
You can’t choose KPIs unless you know what you’re trying to measure. Start the process by defining your business objective . Make sure that your project is in alignment with the rest of your organization by consulting with company leaders and referring to other company-wide documents like your organization’s mission, overarching strategic plan , and department-wide goals.
Depending on what level you’re working from—team manager, department head, director, VP, or company leader—you may be in a position to set both short-term and long-term KPIs. When planning at the executive level, you can set KPIs by the month, quarter, or year.
2. Identify important business metrics
Once you’ve defined your business objective, you need to decide which metrics are relevant to that objective. The metrics you choose for your KPIs should be indicators that directly relate to whether or not you achieve your objective.
Remember: KPI stands for key performance indicators. There may be a variety of metrics or indicators that impact your ultimate goal. Creating the right KPI is about capturing the most important details and making sure you’re tracking those metrics. Not every task or project needs to have an associated KPI.
If you’re not sure where to start, check out some relevant metrics for each department in your organization.
Example financial metrics
Annual recurring revenue (ARR)
Net revenue retention (NRR)
Net profit margin (NPM)
Earnings Before Interest, Taxes, Depreciation, and Amortization (EBITDA)
Operating capital
Example customer metrics
Net promoter score (NPS)
Customer acquisition cost (CAC)
Customer satisfaction (CSAT)
Customer retention
Customer churn
Number of total paying customers
Number of new customers
Example process and operations metrics
Throughput time, or total lead time
Number of complaint or bug tickets filed
Supply chain metrics, like days sales outstanding (DSO)
Example people or human resources metrics
Employee retention rate
Employee satisfaction
Salary competitiveness ratio (SCR)
Example sales metrics
Revenue growth
Market penetration
Customer lifetime value
Gross profit margin
Example marketing metrics
Number of qualified leads
Lead conversion rate
Social media followers
Content downloads
Email click-through rate (CTR)
3. Set up a tracking system
When you’re working on more than one project with more than one team, the number of KPIs you’re tracking can start to add up quickly. It’s important to have a tracking system in place that ensures your data is recorded consistently and at regular intervals. You won’t be able to draw accurate conclusions if you forgot to track some weeks or if you lost the data in a messy file folder.
A KPI dashboard is the best place to keep track of all of your KPIs. Having a central shared dashboard:
Ensures everyone is looking at the same information
Makes KPI data accessible to the entire team, no matter where they are
Eliminates the need to manually notify stakeholders every time something is updated
Can track metrics automatically, so there’s no chance of forgetting
Reduces the likelihood of human error
4. Track and share real-time progress
KPI data isn’t something you neglect until it’s time for your quarterly report. Rather, stakeholders should use KPI reports to make minor and major decisions throughout a project’s lifecycle. That’s why it’s important to keep your KPI data up to date and make it accessible to everyone at any time .
The best way to keep your data up to date is to use a dashboard that tracks and updates in real time. That way, stakeholders won’t need to wait until the next update to get the most recent information—they can just check the dashboard.
If you do track your KPIs manually, make sure you update at regular intervals that make sense for your project. For fast-moving projects, consider sharing updates weekly so everyone is tuned in to any changes. For longer-term, slower-moving projects, consider reporting biweekly or monthly to ensure each update includes enough information to be useful.
If possible, track and share progress in the same place you manage work so your team understands how their individual work contributes to the KPI and, as a result, to your broader company goals. At Asana, we use goal management software to connect our company goals to the work that supports them. With Goals, team members can prioritize projects to get their highest-impact work done.
Examples of KPIs
Key performance indicators are the compass that guides organizations towards their goals. Here are some typical examples of KPIs for different areas.
Financial KPI examples
When it comes to the financial health of a business, key performance indicators act as vital signs. For example, return on investment (ROI) is a common financial KPI. It measures the profitability of an initiative against its cost. To put it simply, if a company spends $1,000 on a marketing campaign and generates $5,000 in sales, the ROI KPI indicates a successful outcome.
When exploring financial metrics, you'll frequently find these examples of KPIs in use.
Net profit margin: Shows what percentage of your sales is actual profit.
Gross profit margin: Tells you how much you're making after covering the cost to make or buy your products.
Operating cash flow: Measures the cash your business makes from normal business operations.
Customer KPI examples
Customer-related KPIs show how well a company is performing from the standpoint of its clientele. Support tickets are a common key performance indicator here. They reflect the number of queries or issues customers report. If a new product launch sees a spike in support tickets within a short period of time, this KPI might signal the need for product improvements or better customer education.
It’s not uncommon for those working in the customer service industry to see the following examples of KPIs.
Customer satisfaction score: A quick way to see how happy people are with what you sell.
Net promoter score: Tells you if your customers like your product enough to tell their friends.
Customer retention rate: Measures how well you're keeping your customers over time.
Process KPI examples
To streamline operations, organizations can track process KPIs. An example is the employee turnover rate. This helps teams understand how often they have to replace staff. A high turnover rate over a six-month period of time could point to deeper issues within the work environment that need addressing.
Here are a few other common examples of KPIs you'll see in process tracking.
Efficiency ratio: Used to check if you're making good use of what you own to make money.
Cycle time: Measures how long it takes to get something done from start to finish.
First-time right: Shows how often you get things right the first time without any do-overs.
Marketing KPI examples
Marketing efforts can be gauged using website traffic as a key performance indicator. This metric helps businesses optimize their online presence. For example, if a new blog post aimed at explaining the different types of KPIs sees a 50% increase in visitors, the content can be considered effective in attracting more interest.
In the marketing department, it's common to come across the following examples of KPIs.
Cost per lead: Helps you figure out how much you're spending to get someone interested in what you're selling.
Conversion rate: Tells you what percentage of your website visitors are doing what you want them to do.
Click-through rate: Shows how often people click on a link you've given them.
Project management KPI examples
Project managers often use a "balanced scorecard," a strategic KPI framework that evaluates initiatives from various perspectives—financial, customer, process, and growth.
Let's say a sales team is tasked with improving customer outreach. Their scorecard may reflect how well they're meeting this organizational goal across different performance measures, like sales KPIs, over a quarterly time frame.
For a closer look at project management metrics, consider these other examples of KPIs.
Return on investment: Measures whether the money you put into something is worth what you're getting out of it.
Earned value: Helps you see how much of your project you've gotten done at any point.
Critical path length: Measures the total time your project will take, based on the things you can't skip.
Keeping an eye on these key performance indicators helps you figure out how close you are to hitting your goals and what you might need to tweak to get there.
Pros and cons: Key performance indicators
Key performance indicators can be extremely useful, but they also have their drawbacks. Let's take a closer look at both sides.
Benefits of KPIs
They help managers see specific issues through clear data, which is great for making plans and improving an organization.
They use hard numbers to show how employees are doing, which keeps everyone on the same page and removes guesswork.
They can actually motivate employees to do better when they see their performance is being analyzed.
They link day-to-day work with the company's bigger targets and show if the company is really getting to where it wants to go.
Disadvantages of KPIs
It can take a lot of time to collect KPI data, especially if you're looking at how things change over several years.
You have to keep an eye on your indicators and update them to make sure they're still useful.
There's a risk that managers might just focus on hitting KPI numbers instead of truly improving the business.
If the specific goals aren't set right, they can be too tough to meet, which can stress out team members.
KPIs vs. OKRs
KPIs aren’t the only way to track project performance. OKRs , or objectives and key results, are another type of measurement tool that functions in a similar way to KPIs. In fact, in many cases, the KPIs and OKRs for a project could overlap.
![[inline illustration] KPIs vs. OKRs (infographic)](https://assets.asana.biz/transform/8c5e1700-8e49-4d3d-8279-25cc30a25648/inline-goals-what-are-kpls-2-2x?io=transform:fill,width:2560&format=webp "how to write a kpi proposal")
Here are the differences and commonalities between KPIs and OKRs:
Key performance indicator (KPI): Designed to measure performance over time, a good KPI should track one measurable value that can indicate the rate of progress toward a goal.
Objectives and key results (OKRs): OKRs use the template “ I will [objective] as measured by [key result]. ”The objective is the goal you want to achieve and the key results are the metrics used to track progress toward that objective. You can have more than one key result for each objective.
KPIs often overlap with OKRs, but the difference is that OKRs don’t have to be quantifiable measures. For example, you could set an OKR to “Improve the workplace environment as measured by employee morale,” even though your OKR, employee morale, is intangible. If you wanted to set a KPI for the same objective, you’d have to find a way to quantify employee morale—say, number of HR complaints received or new hire turnover rate.
OKR vs KPI examples
Here’s another example of potential OKRs and KPIs for a customer experience team.
Example KPI: Increase net promoter score (NPS) by 2 points in FY21.
Example OKRs:
Objective: Surprise and delight our customers to increase customer satisfaction and loyalty.
Key result: Generate positive buzz through social media and virtual events.
Key result: Reduce churn to less than 2% per month.
Key result: Increase net promoter score (NPS) by 2 points in FY21.
What does KPI stand for?
KPI is an acronym that stands for "key performance indicator." It's a term used widely across various industries to describe measurable values that organizations can track to gauge how effectively they are achieving key objectives.
What is the most important KPI?
The most important KPI often depends on the specific goals of an organization. For many, it could be related to financial performance, like net profit margin, which shows the amount of profit made as a percentage of revenue. However, what's most important is that the KPIs a team chooses should directly support their specific goals, ensuring that they are relevant and provide actionable insights.
What is a KPI in marketing?
A key performance indicator in marketing refers to a measurable metric that marketing teams use to assess the effectiveness of their campaigns and specific goals. For example, a marketing team may track the conversion rate of a campaign to determine how effectively it turns prospects into customers.
What is a KPI in business?
In a broader business context, a KPI serves as a numerical indicator that organizations use to measure their performance against their strategic goals. Teams can automate the collection and reporting of these metrics, thanks to integrations with business intelligence tools, which allows for real-time monitoring and more informed decision-making.
KPIs, OKRs, SMART goals, oh my!
KPIs are a great way to set quantifiable goals that connect to your strategic objectives. But if KPIs don’t feel right for you, th ere are a variety of other goal-setting methodologies you can try.
To get started, read our articles about how to set OKRs , write better SMART goals , or create great short-term goals .
Related resources

7 steps to complete a social media audit (with template)

How to accomplish big things with long-term goals

What are objectives and key results (OKRs)?

Fix these common onboarding challenges to boost productivity
What Is KPI Reporting? KPI Report Examples, Tips, and Best Practices

Table of contents

Enjoy reading this blog post written by our experts or partners.
If you want to see what Databox can do for you, click here .
We’re constantly bombarded by data points and it takes real effort to make sense of them. While having a lot of information is a good thing, it’s easy to get overwhelmed and miss what’s really important. Businesses especially need to be able to sort the wheat from the chaff and assess their data accurately.
But, how do you go about this exactly?
A recent Databox’s research proved that it’s not an easy task – in fact, more than half of the surveyed companies are not sure they are tracking the right KPIs.
It all starts from businesses understanding their audience, collating the relevant information, analyzing it, and then leveraging it all in order to make strategic decisions that will lead to success.
This is where tracking KPIs and ensuring that information is presented in a digestible format comes in. And using KPI reporting tools will streamline the whole process.
We’ll explain what KPIs are, explore KPI reporting in depth, and cover a variety of useful reports as well as give you some of the best practices for creating a KPI report.
- What is a KPI?
- What is a KPI Report?
- What is the Difference Between a KPI Report and a KPI Dashboard?
- How Do I Prepare a KPI Report?
- How to Distribute a KPI Report?
- KPI Reporting Examples and Templates
- KPI Examples
KPI Reporting Best Practices
Build more insightful kpi reports with databox.

What Is a KPI?
Let’s start with the basics. A key performance indicator (KPI) is a way to measure the performance of a project or a business in achieving a specific goal. The best way to think of them is as milestones that can be used to gauge progress and provide insight that will help you make better decisions. KPIs are applicable in any business sphere and used in every industry. Businesses of all sizes track KPIs and use them to measure success and plan future endeavors. While this may sound like simple metrics tracking , KPIs are more strategic and have the greatest impact on business planning. While all KPIs are metrics, not all metrics are KPIs. Non-KPI metrics support KPIs and aren’t as crucial in and of themselves.
Related : KPIs vs. Metrics: What’s the Difference & How Do You Measure Both?
KPIs can provide you with a realistic look at how your business is doing, providing information about everything from risk factors and opportunities to financial indicators. As such they can keep the whole organization moving in the same direction and allow you to course-correct as necessary.
What Is a KPI Report?
A KPI report is a performance tracking tool that allows you to quickly analyze key performance indicators and understand how your organization is doing with respect to specific goals. They include data visualization, consisting of charts, tables, and graphs. Modern KPI reports are interactive, and all the underlying data can be accessed quickly. In addition, they allow you to reorganize displayed information which allows for a quick change of focus.
Related : Business Report: What is it & How to Write a Great One? (With Examples)
Why Are KPI Reports Important?
KPIs are more than just numbers or even metrics. They make it possible to understand how your business is performing, allowing you to make adjustments in your procedures and achieve your long-term goals. Identifying the right KPIs and measuring them will help you achieve results more quickly, and you’ll have a better insight into how well you did.
A well-made KPI report with an organized dashboard provides important insights in an easy-to-understand format, allowing everyone to understand the overall situation. That way, even non-technical personnel can recognize relationships between data points and identify trends. This means that relevant people will be able to correctly set business objectives and chart a course for achieving them.
PRO TIP: How Are Users Engaging on My Site? Which Content Drives the Most Online Activity?
If you want to discover how visitors engage with your website, and which content drives the most engagement and conversions, there are several on-page events and metrics you can track from Google Analytics 4 that will get you started:
- Sessions by channel. Which channels are driving the most traffic to your website?
- Average session duration. How long do visitors spend on your website on average?
- Pageviews and pageviews by page . Which pages on your website are viewed the most?
- Total number of users . How many users engaged with your website?
- Engagement rate . Which percentage of your website visitors have interacted with a piece of content and spent a significant amount of time on the site?
- Sessions conversion rate . How many of your website visitors have completed the desired or expected action(s) and what percentage of them completed the goals you’ve set in Google Analytics 4?
And more…
Now you can benefit from the experience of our Google Analytics 4 experts, who have put together a plug-and-play Databox template showing the most important KPIs for monitoring visitor engagement on your website. It’s simple to implement and start using as a standalone dashboard or in marketing reports, and best of all, it’s free!

You can easily set it up in just a few clicks – no coding required.
To set up the dashboard, follow these 3 simple steps:
Step 1: Get the template
Step 2: Connect your Google Analytics account with Databox.
Step 3: Watch your dashboard populate in seconds.
What Is the Difference Between a KPI Report and a KPI Dashboard?
While an interactive KPI report you can use to navigate through different metrics and perform data exploration and analysis is fairly similar to modern KPI dashboards , they’re not necessarily the same thing. Traditional KPI reports are static documents distributed to shareholders, while interactive dashboards allow for much easier access to different layers of information.
KPI reports focus on the analytical interpretation of underlying metrics , mostly via tables and graphs that make decision-making easier. On the other hand, dashboards are visualization tools that can support KPI reports — they employ various visual formats like graphs and charts that give real-time insight into KPI and metric performance.
Today, the line between the two is very much blurred. Modern Dashboards are robust enough to take on the role of a full-fledged report, or they can be integrated into the report. Additionally, nothing is stopping you from feeding information from a KPI Report into a dashboard in order to create a pleasing and impactful presentation.
How Do I Prepare a KPI Report?
In order to prepare a good KPI report, you need to gather data and answer some questions. It’s best to present all important metrics. Ideally, you want to present performance over a period of time and showcase recent growth, decreases, and outliers.
In essence, no two KPI reports are the same. They need to be tailored to the user, industry, business, audience, and so on. You can and should customize your reports in order to match your requirements, and fortunately, modern reporting tools and dashboards can make the whole thing a breeze.
So, here’s what you should think about when you’re preparing a KPI report.
Consider your goals
Choose the right kpis, check your data, ensure you know who’ll use the report, consider the visualization.
First, you need to decide what your desired business result is. Set out your long-term goals and consider the steps you need to take to achieve them. The goals need to be feasible and paired with measurable results. Don’t forget to add milestones and expected changes in the numbers or percentages.
Related : Goals Based Reporting: Everything You Need to Know
Second, select the KPIs you want to use to measure your progress. In order to create a useful KPI, you need to determine how you intend to reach the goals defined in the previous step. Set down what key activities will bring your business closer to reaching each of these goals and make sure they’re quantifiable.
Third, take a look at your data sources . Thanks to modern dashboards, you can consolidate all the data you need. The process can be made even easier with reporting software and its integrations that allow you to automatically import information from other sources. Dashboards can crunch numbers for you and present insights based on your KPIs. However, in order to do that, they need access to good data.
That’s why you need to audit your data sources and make sure they align with your business objectives. Exclude chaff information that will only clutter up the dashboard, a KPI report needs to be trim, relevant, and actionable. If you do this, you’ll streamline the whole process and ensure that you only see information that needs to be analyzed.
Fourth, plan for the target audience. Consider who’s going to see and use the KPI report. If no one is interested in tracking a specific KPI, then there’s no real point in adding it to the dashboard. If the metric reflects a downward trend, then ensure that there’s a plan to correct this or that there’s someone ready to make that plan. In addition, keep in mind that not all people viewing the report may have permission to see the data reflected in the KPIs. Some information is confidential or just not relevant to some people so it may be worth it to create different versions of KPI reports for different audiences.
Fifth, take into account the visualization itself. How will the metrics be displayed? Will you use bar charts, graphs, pie charts, line charts, or something else to present a KPI and supporting metrics? You can place similar metrics close to each other to create a natural flow of information. This makes it easy to find all the relevant information.
By visualizing data properly, you can tell a story about how the business is performing. If you emphasize what truly matters in an easy-to-understand format, you’ll be able to share critical information even with people who aren’t too familiar with the subject matter.
How to Distribute a KPI Report
Of course, creating a successful KPI reporting strategy requires more than building informative and actionable reports. Without people to review them and implement the strategies suggested, the reports aren’t worth much. So distributing them to people who can use the information is vital.
Managers, project stakeholders, and other staff are there “in the trenches” and can see the effects of their actions directly. This is why distributing the reports at the project management level is vital. These people will be able to act on the reports and inform their coworkers about the progress towards the objectives that have been set up.
You can distribute them either through static reports (usually at scheduled meetings) or through live reports. Unfortunately, static reports often contain outdated information as collection, collation, and distribution are done manually, which comes with an inevitable time delay. Live reports can be distributed either as KPI dashboards that show trends and graphs or traditional reports with tables that display numeric data.
While they can be “distributed” by sending people emails or chat messages with links towards reports, they always exist and can be accessed anytime and anywhere. This real-time accessibility allows the recipients to have data at their fingertips and to make decisions in a timely fashion instead of waiting for the report to be compiled and then distributed. It makes the whole process much more streamlined and minimizes the chance of errors.
KPI Reporting Examples & Templates
Of course, there are countless possible reports you can make, all depending on what you’re trying to achieve, the type of organization, and the target audience. Here are templates and examples of some of the most common KPI reports you might need to make.
SEO report template
Employee performance dashboard, social media report template, financial kpi reporting template.
- Project management KPI report template
Sales performance KPI dashboard
- Customer support KPI dashboard
SaaS executive dashboard
Software development dashboard, ecommerce report example.
This SEO report template will help you track organic search performance in Google by showing you how your site is performing in organic search results. You’ll also see the changes in that performance by noting high-performing pages, keywords, and queries, as well as your average ranking.
An SEO report will help you identify which queries you should focus on, and you’ll be able to optimize search snippets to improve your CTR from search results. The key metrics are impressions, clicks, costs, clicks by queries, pages by clicks, position, and crawl errors.

If you need to make a more specific SEO KPI report, you can browse our library of SEO dashboard templates .
If you want to track custom metrics from Jira, this employee performance dashboard is exactly what you need. This is especially true if you use Agile principles.
By tracking key metrics like hours tracked, billable hours, and billing amounts, you’ll be able to visualize the data from Harvest in the way you want. The template will allow you to split tracked time by project, team, task, or client. It makes it easy to see how many hours have been tracked on a monthly, quarterly, and annual basis.

You can also browse all of our employee performance dashboards and customize them according to your needs.
Social media report templates can give you insights into how your social media campaign is progressing by tracking metrics like impressions, reach, followers, and more. If you want to track the performance of your business Instagram account, you’ll be able to see what posts have been popular with your followers, see the impact of your activity, and communicate how social media strategy is impacting the overall ROI.

All Databox’s social media dashboard templates come pre-built with the most commonly tracked metrics and are fully customizable. You can browse our library of social media dashboards and pick the right one for your purposes.
A well-made financial reporting dashboard will give you insight into your business’ bank accounts, cash flows, sales, expenses, etc. Databox’s financial reporting dashboards like this Quickbooks financial report can be integrated with accounting and streamline the whole reporting process with just a few clicks.
You can use them to track your company’s financial transactions, open and unpaid invoices, debits and credits, and many more metrics. They can even visualize cash flow projections and allow you to sort all the data by any category you wish.

Browse the full selection of our financial dashboards , and you’re guaranteed to find something you need.
Project Management KPI report template
Project management KPIs are possibly the most important for the long-term health of any organization. If you connect a dashboard to your work management software, you’ll be able to keep your workflow organized and track your team’s progress very easily.
With a project management report , you’ll be able to monitor relevant metrics related to task organization like assigned tasks, overdue, completed, and assigned tasks, time spent on tasks, team performance and productivity, and many more. These, in turn, can be turned into indicators of the health of the organization. An increasing number of overdue tasks could be a sign that there are workflow issues that need to be addressed.

You can browse all project management dashboards and find the one that works for your organization.
This type of KPI report dashboard is a visual snapshot of the sales team’s performance. You can use sales performance KPI dashboards to track sales performance and productivity KPIs, sales leaderboards, and progress towards achieving goals. You’ll be able to understand the sales pipeline better and compare team results with revenue goals.

Databox has a large selection of sales dashboards you can browse.
Customer support KPI dashboard template
This customer support report template that pulls data from Intercom is easy-to-use and allows you to assess your overall Help Desk performance and efficiency of individual customer service agents. You can integrate it with Intercom or any other CRM software and pull up a variety of metrics from leads and conversations to average handle time and customer satisfaction. You can use these data points and collate them into useful and actionable KPIs for your KPI report.

If you need a different dashboard, you can browse our library of customer support dashboards .
Executive dashboards include an array of important SaaS metrics like Monthly Recurring Revenue (MRR) and churn rate. By using it you’ll learn how much did you make on any given day, the number of current customers, the percentage of customers churned in a specific time period, how much revenue was lost due to customer churn, etc. This can be built using an executive dashboard software .

You can also browse the full list of our SaaS dashboards and pick whatever suits your business.
Software development reports can help you track new features and bug fixes across your digital portfolio. They’re powerful collaboration tools that will enable your software team to execute projects quickly and efficiently. You’ll learn how many changes were made to the projects over a period of time, the number of branches, commits, and forks in the selected repository, the number of open issues that you can sort by kind, and so on.

All of our dashboards are fully customizable, and if you’d like a wider selection, you can browse our library of software development dashboards .
Ecommerce reports allow you to get full insights into your online sales statistics, product performance, conversion rate, and many more metrics. If you integrate it with Google Analytics, Facebook Ads, or Shopify, you’ll have access to a variety of data points you’ll be able to use to put together actionable KPIs and build useful KPI reports.

Check out our full selection of ecommerce dashboard templates and pick the one that suits your needs.
KPI Examples
As we mentioned, metrics need to be selected with the target audience in mind. There’s no single list of best KPIs that are suitable for every report and every circumstance. However, there are some that tend to be more broadly applicable and can be used by various departments to measure performance.
Financial KPIs
Customer support kpis, marketing kpis, project management kpis.
These are particularly important to C-suite and the accounting department. After all, revenue information is perhaps the clearest measure of a business’ profitability.
Here are some common and useful financial KPIs :
- Gross Profit Margin
- Net Profit margin
- Current Ratio
- Return on Equity
- Debt-to-Equity Ratio
- Inventory Turnover
Important for any business that wants to maintain a good relationship with their customers. They’re useful for managers, executives, and agents in companies that deal with customers on a daily basis.
The effective use of these metrics can improve productivity and create efficient processes.
Here are some very useful customer support KPIs :
- Average Response Time
- Customer Churn
- Number of Issues
- Customer Retention
- First Call Resolution
- Top Support Agents
These metrics provide insight into the effectiveness of marketing campaigns and are invaluable to not only marketing agencies but also to any business that relies on advertising (which is probably every business, at this point).
Marketers should keep track of the following KPIs:
- Return on Investment
- Return on Ad Spend
- Conversion Rate
- Customer Acquisition Cost
- Lifetime Value of a Customer
- SEO Keyword Ranking
Sales performance information needs to cover both completed work and the effectiveness of existing processes. Sales teams are the natural audience for these metrics, as are their managers and some executives.
Here are important sales KPIs :
- Sales Revenue
- Sales Growth
- Product Performance
- Sales Target
- Average Purchase Target
- Quote to Close Ratio
Looking for an effective tool to help you track your sales KPIs? Check out this sales dashboard software .
KPIs for project management cover a team’s ability to achieve goals. Project managers and their supervisors can make the best use of this data to ensure better team cohesion and improved performance in the future. They cover quality, timeliness, budget, and effectiveness.
Here are some important project management KPIs :
- Cost Performance Index
- Employee Churn Rate
- Number of Project Milestones
- Customer Complaints
Focusing on the right metrics is important. You don’t want to waste resources on measuring and monitoring KPIs that don’t matter. Poorly constructed KPI report with poorly chosen metrics can easily send you on the wrong path and waste opportunities or even cause irreparable damage to your business.
To help you with that, we’ve put together a list of best practices for KPI reporting.
Keep it simple
Set clear objectives, ensure the data is consistent and accurate, understand the relationship between kpis, embrace digital accessibility, coordinate across the organization, perform regular reviews.
It’s easy to get overwhelmed by the sheer number of data points available. The best idea is to focus on a small number of KPIs (key is the operative word in key performance indicators) and measure only the metrics that align with your business objectives. The most common KPIs aren’t necessarily the most important, and you should tailor your report to include only what’s truly relevant.
This is an extension of the previous point but avoid the temptation to add more information to the report without a clear reason to do so. Make a plan and stick to it. You want the report to be clear and concise and not bury the target audience under a mountain of data.
The computing maxim “garbage in, garbage out” applies to all data analysis applications. You simply cannot trust the result if the data isn’t up to par. Spend some time testing data sets and double-checking inputs before deciding to use them.
Metrics don’t exist in isolation. They impact each other, and sometimes it isn’t clear what caused a change (or what will cause the change) until you dig deeper and examine their relationships.
This is important when developing KPIs because just wanting to increase certain metrics without understanding underlying causes can cause them to stagnate until you identify exact ways to improve them.
Using cloud-level solutions can make the whole process much simpler and even faster. Having immediate central access to a variety of data points is simply a must in today’s fast-paced world if you want your KPI reports to be useful by the time you’re done with them.
If you have something that’s not digitized, digitize it, and ensure that all metric sources are integrated with the right reporting dashboards.
The best reports require input from multiple people. Invite coworkers or stakeholders who will have to act on the information in the report to provide input about the required metrics. If you can, organize brainstorming sessions with relevant personnel before building KPIs and create dashboards and data visualizations that will make the communications and planning simpler.
Objectives change with time. Old ones are achieved, the market shifts or the company decides to pivot in a new direction. It’s important to regularly review existing KPIs and ensure they’re still relevant. This will ensure you’re tracking metrics that matter and that your business will continue to benefit from them.
As you can see, writing a KPI report can be a complex task. You need to be able to analyze a lot of information and identify important data points that will be useful to your business. These reports then need to be kept up to date, variables need to be monitored, and relevant people need to be in the loop.
However, it doesn’t have to be that time-consuming or complex.
With Databox, you can build more insightful KPI reports in less time, and it only takes a few clicks to get started. Stop wasting time on time-consuming busy work. Connect the relevant data sources, customize one of our existing dashboard templates or build your own, and visualize the data in one spot. You’ll be able to create lean and actionable KPI reports that will make sure your business is on the right track.
Sounds good? Feel free to try it out. Just sign up for a free trial and make KPI reporting easier than you thought possible.
Do you want an All-in-One Analytics Platform?
Hey, we’re Databox. Our mission is to help businesses save time and grow faster. Click here to see our platform in action.
- Databox Benchmarks
- Future Value Calculator
- ROI Calculator
- Return On Ads Calculator
- Percentage Growth Rate Calculator
- Report Automation
- Client Reporting
- Google Sheets KPIs
- Sales Analysis Report
- Shopify Reports
- Data Analysis Report
- Google Sheets Dashboard
- Best Dashboard Examples
- Analysing Data
- Marketing Agency KPIs
- Automate Agency Google Ads Report
- Marketing Research Report
- Social Media Dashboard Examples
- Ecom Dashboard Examples

Does Your Performance Stack Up?
Are you maximizing your business potential? Stop guessing and start comparing with companies like yours.

A Message From Our CEO
At Databox, we’re obsessed with helping companies more easily monitor, analyze, and report their results. Whether it’s the resources we put into building and maintaining integrations with 100+ popular marketing tools, enabling customizability of charts, dashboards, and reports, or building functionality to make analysis, benchmarking, and forecasting easier, we’re constantly trying to find ways to help our customers save time and deliver better results.
Davor is an English literature graduate and an avid reader with a passion for languages. Working as a translator, editor, and writer has allowed him to learn about a wide range of topics — making him something of a jack-of-all-trades when it comes to content. In his spare time, he reads, plays video games and boardgames, and runs/plays tabletop RPGs.
Get practical strategies that drive consistent growth
12 Tips for Developing a Successful Data Analytics Strategy

What Is Data Reporting and How to Create Data Reports for Your Business

How to Write an Executive Summary for a Report: Step By Step Guide with Examples

Build your first dashboard in 5 minutes or less
Latest from our blog
- BTB: Mastering Data-Driven Legal Marketing Success (w/ Guy Alvarez, Good2BSocial) May 15, 2024
- The State of B2B Content Creation: Navigating the Future of In-House Marketing Innovation May 9, 2024
- Metrics & KPIs
- vs. Tableau
- vs. Looker Studio
- vs. Klipfolio
- vs. Power BI
- vs. Whatagraph
- vs. AgencyAnalytics
- Product & Engineering
- Inside Databox
- Terms of Service
- Privacy Policy
- Talent Resources
- We're Hiring!
- Help Center
- API Documentation

Künstliche Intelligenz in Unternehmen: Innovative Anwendungen in 50 erfolgreichen Firmen
Der Bestsellerautor und Geschäfts renommierter KI-Experte Bernard zeigt, wie sterben Technologie des maschinellen Lernens das von Unternehmen verändert. Das Buch bietet einen Überblick über einzelne Unternehmen, beschreibt das spezifische Problem und erklärt, wie KI die Lösung erleichtert. Jede Fallstudie bietet einen umfassenden Einblick, der einige technische Details wichtige Lernzusammenfassungen enthält. Marrs Buch ist eine aufschlussreiche und informative Untersuchung der transformativen Kraft der Technologie in der Wirtschaft des 21. Jahrhunderts.

Bernard Marr
Bernard Marr is a world-renowned futurist, influencer and thought leader in the fields of business and technology, with a passion for using technology for the good of humanity. He is a best-selling author of over 20 books, writes a regular column for Forbes and advises and coaches many of the world’s best-known organisations. He has a combined following of 4 million people across his social media channels and newsletters and was ranked by LinkedIn as one of the top 5 business influencers in the world.
Bernard’s latest books are ‘Future Skills’, ‘The Future Internet’, ‘Business Trends in Practice’ and ‘ Generative AI in Practice ’.

Bernard Marr ist ein weltbekannter Futurist, Influencer und Vordenker in den Bereichen Wirtschaft und Technologie mit einer Leidenschaft für den Einsatz von Technologie zum Wohle der Menschheit. Er ist Bestsellerautor von 20 Büchern, schreibt eine regelmäßige Kolumne für Forbes und berät und coacht viele der weltweit bekanntesten Organisationen. Er hat über 2 Millionen Social-Media-Follower, 1 Million Newsletter-Abonnenten und wurde von LinkedIn als einer der Top-5-Business-Influencer der Welt und von Xing als Top Mind 2021 ausgezeichnet.
Bernards neueste Bücher sind ‘Künstliche Intelligenz im Unternehmen: Innovative Anwendungen in 50 Erfolgreichen Unternehmen’
A Sample KPI Template
2 July 2021
Designing your own Key Performance Indicators (KPIs) can be fraught with ambiguity and inconsistency. To help smooth the way, I’ve developed a sample KPI template that you can use when designing your own indicators. This is based on 20 years of practical experience helping companies develop relevant and meaningful business metrics and is the template I use with my clients.

What is a KPI?
The definition of a KPI is a measurement or indicator that helps an organisation understand how well it is performing in relation to its strategic goals and objectives. In short, a KPI shows whether an organisation is on track or not. KPIs also help reduce the complex nature of organisational performance to a small, manageable number of key indicators – indicators which provide insights that can, in turn, assist decision making and ultimately improve performance.
Your Key Performance Indicator Template
The first four elements of the sample KPI template address the basics of any KPI and help to put it in context. The remaining elements cover the more technical aspects of the data collection as well as some tests to ensure you have developed a sensible indicator.
You can use this sample KPI template to develop completely new KPIs or improve the effectiveness of your existing KPIs. Either way, ensure that each KPI you develop covers the following sections.
Strategic goal
It’s always best to clearly specify to which strategic objective the KPI relates, so that everyone looking at the KPI immediately appreciates its relevance.
Example: Grow customer satisfaction.
Audience and access
Here you define the primary audience for this KPI – basically, who is this data for and who will have access to it.
Example: The Board of Directors and Marketing Team.
Key Performance Question (KPQ)
Your KPI template should state the Key Performance Questions (KPQ) that the indicator is helping you to answer. This helps to provide context around why this particular KPI is being introduced and on which specific issue it is going to shed more light.
Example: To what extent are our existing customers satisfied with our service?
How will and won’t this indicator be used?
Specify how the KPI will be used so that everyone is clear about how you plan to use the information. Also define how the KPI will not be used. Sometimes, people are scared to report on measures because they fear negative results could be used against them. Here, you can say that the KPI won’t be used to determine the performance of individuals and won’t be linked to bonus payments.
Example: The indicator will be used to assess and report on our customer success internally.
It will not be used to assess performance of individuals or to determine bonus payments.
Indicator name
Every KPI needs a name so that you can discuss it collectively. Choose a name that clearly explains what the indicator is about.
Example: Net Promoter Score (NPS).
Data collection method
Your KPI template should identify and describe the data collection method you are going to use for each KPI. Data collection methods can include surveys, questionnaires, interviews, sensor data collection, focus groups, automated machine data collection as well as collection of archival data.
Example: The data will be collected using a mail-based survey.
Assessment/formula/scale criteria
Describe how performance levels will be determined. This can be qualitative, in which case the assessment criteria need to be identified, or it can be numerical or using a scale, in which case the formula or scales with categories need to be identified.
Example:Using a 0-10 scale (Not at all likely to extremely likely) participants will answer: How likely are you to recommend us to a friend?
NPS = percentage of Promoters (score 9-10) – 5 of Detractors (score 0-6).
Targets and performance thresholds
Define a target or benchmark for each indicator. Here you can also outline the performance thresholds, that is, when performance levels are judged to be good or bad. Example: NPS of 55% by the end of 2020.
Source of data
Your KPI template should specify where the data is coming from so that people using the KPI can be assured of its reliability and validity.
Example: Survey of existing customers.
Data collection frequency
State how often the data for the KPI will be collected and coordinate the collection dates accordingly. Some KPIs require data to be collected continuously. Others specify hourly, daily, monthly, quarterly or annual collection. Make sure your schedule allows enough time to collect the data, chase people where necessary, analyse it, aggregate it, solve any issues and deliver the report while still ensuring the data it contains is as recent as possible.
Example: Monthly data collection from a sample of 10% of our customer database.
Data reporting frequency
Specify when and how often the data for the KPI will be reported. It makes sense to coordinate the data collection and reporting frequency to ensure the data you are reporting is as current and up-to-date as possible. You don’t want to end up in a situation where data is collected in January and reported at the end of the year!
Example: Monthly reporting.
Data entry (responsible person)
Your KPI template should also specify the individual or job title of the person responsible for the data collection and data updates. The owner of the KPI can be a named employee or business function, or, sometimes, an external agency.
Example: Ian Miller, Marketing Assistant.
Expiry/revision date
The key performance indicator template should always include an expiry date or revision date. KPIs are sometimes only needed for a specific period of time and without an expiry or review date these KPIs can continue indefinitely, causing unnecessary work. Even if indicators are not time- or project-specific they should be assigned a review date to ensure they remain relevant and useful.
Example: In 12months’ time.
How much will it cost?
Measurement and data collection can be expensive. It’s important to estimate the costs for collecting and monitoring an indicator and evaluate whether the costs are justified.
Example: Costs are significant but cheaper than a traditional customer satisfaction survey.
How complete is this indicator?
Your KPI template should briefly assess how well this indicator is helping to answer the associated key performance question and identify possible limitations.
Example: It provides us with a nice simple number, but the data should ideally be supplemented with unstructured customer feedback about what is particularly good and what could be improved.
Briefly describe how this indicator could influence the wrong behaviours or how people could cheat on this KPI.
Example: People could possibly influence customers before they take the survey or they could select customers who are likely to respond positively.
Here you can download the completed KPI template (PDF format) which contains two examples.
Download now
Where to go from here
If you would like to know more about KPIs and performance management, cheque out my articles on:
- How to Develop Effective KPIs
- The 10 Biggest Mistakes Companies Make With KPIs
- 6 Simple Steps To Great Key Performance Questions (KPQs)
Or browse the KPI section of this site or our KPI Library to find the metrics that matter most to you.

Related Articles

The Top 5 Tech Trends In 2024 Everyone Must Be Ready For
Once again, we’ve reached the time of year when we look ahead at what technology has in store for us in 2024.[...]

The Amazing Ways Coca-Cola Uses Generative AI In Art And Advertising
Some say that in the very near future, we’ll need to either adopt artificial intelligence (AI) or be made redundant by it – or by others using it.[...]

The 5 Biggest Risks of Generative AI: Steering the Behemoth Responsibly
In our contemporary world, the pressures of the professional sphere often encroach upon our personal space, giving rise to stress and an overwhelming sense of dread.[...]

3 Ways To Reinvent Your Products And Services For The Future
With the rise of the metaverse and web3 technologies, there’s no denying the next evolution of the internet is already underway.[...]

Virtual Influencer Noonoouri Lands Record Deal: Is She The Future Of Music?
Teenage influencer Noonoouri has 400,000 followers on Instagram and has starred in fashion campaigns for Dior, Balenciaga and Valentino.[...]

Managing Stress at Work: 5 Top Tips Anyone Can Follow
Sign up to stay in touch.
Bernard Marr is a world-renowned futurist, influencer and thought leader in the fields of business and technology, with a passion for using technology for the good of humanity.
He is a best-selling author of over 20 books, writes a regular column for Forbes and advises and coaches many of the world’s best-known organisations.
He has a combined following of 4 million people across his social media channels and newsletters and was ranked by LinkedIn as one of the top 5 business influencers in the world.
Bernard’s latest book is ‘ Generative AI in Practice ’.
Social Media
Metrics and KPIs to Measure Proposal Success
Best practice, january 22, 2024.

If you’re in the business of crafting proposals, you know that measuring their success isn’t always straightforward. The ability to craft winning proposals requires more than just persuasive language and compelling arguments. Understanding the impact and effectiveness of your proposals is crucial to improving your win rates and driving business growth. This is where metrics cand Key Performance Indicators (KPIs) come into play.
Metrics vs KPIs
Metrics are quantifiable measures that are used to track and assess the status of a specific process. They can be used in any business area, such as sales, marketing, finance, production, etc., and they provide a data-driven snapshot of performance in a particular area.
KPIs on the other hand, are a subset of metrics that focus specifically on critical areas of performance that directly impact an organisation’s strategic goals and objectives. In simple terms, all KPIs are metrics, but not all metrics are KPIs. KPIs are the most important metrics that provide a clear indicator of performance towards key business objectives.
Metrics carry several benefits:
1. Performance assessment: Metrics offer a clear and quantifiable measure of how a company is performing in its bid processes. They provide an objective basis for assessing the effectiveness of proposal strategies and tactics.
2. Process improvement: By tracking metrics, companies can identify areas of strength and weakness in their bid processes. This can guide them in making necessary improvements, such as enhancing proposal quality, refining bid strategies, or improving project management.
3. Decision Making: Metrics can inform strategic decisions, such as which opportunities to pursue or how to allocate resources. For instance, a company with a low win rate might decide to be more selective in bidding, focusing on opportunities where it has a higher chance of success.
4. Competitive analysis: Metrics can provide insights into a company’s competitive position. For example, a high win rate can indicate a competitive advantage, while a low win rate might signal a need for differentiation or innovation.
5. Accountability: Metrics create accountability within the organisation. They allow for tracking the performance of individual team members or departments, which can motivate improved performance and foster a culture of accountability.
6. Forecasting: Metrics can also help with forecasting future performance and setting realistic goals. By analysing trends in win rates or other key metrics, companies can set informed targets for future bid activities.
KPIs, on the other can, can be used to measure proposal success:
1. Win Rate: The win rate is a simple yet critical KPI that measures the percentage of proposals that result in a win. It’s an effective way to gauge your proposal’s overall success and the effectiveness of your qualification process and bid strategy.
2. Proposal Turnaround Time: This KPI measures the average time it takes to prepare and submit a proposal from the moment the opportunity is identified. Keeping track of this can help identify bottlenecks in the process and improve efficiency.
3. Cost of Proposal: This KPI quantifies the resources spent on creating a proposal. By tracking this, you can identify opportunities for enhancing efficiency and reducing the cost of proposal development.
4. Quality Score: The quality (or non-price) score of your proposals can be assessed through client feedback, evaluation scoring reviews, proposal audits, or win/loss analysis. This KPI helps you understand the strength of your proposals and areas that need improvement.
5. Proposal Volume: Tracking the number of proposals your team produces within a specific period can provide insights into your team’s capacity and efficiency.
6. Customer Satisfaction: Measuring customer satisfaction with the proposal process helps you understand how well your proposals meet customers’ needs and expectations. This KPI can be a strong indicator of future business opportunities.
7. Compliance Rate: The compliance rate measures the percentage of proposals that meet all required specifications and guidelines. A high compliance rate minimizes the risk of disqualification and reflects well on your organisation’s attention to detail.
8. Conversion Rate: This KPI measures the percentage of submitted proposals that progress to the next stage of the sales cycle. A high conversion rate indicates that your proposals are compelling and persuasive.
It’s important to remember that the KPIs you choose should align with your organisation’s strategic goals and objectives. By tracking these indicators, you can gain valuable insights into your proposal process, improve your strategies, and ultimately, win more business.
At Bidhive , we’re committed to helping businesses streamline their proposal processes and improve their win rates. To learn more about how we can assist your organisation, please get in touch with us today.

Strategise to Win: Transitioning to a Proactive Bidding Mindset
by Nyree McKenzie | May 10, 2024 | Best Practice | 0 Comments
International Development Bidding: Strategies for Success
by Nyree McKenzie | May 6, 2024 | Best Practice | 0 Comments
Harnessing the Power of Data-Driven Bid Narratives
by Nyree McKenzie | April 16, 2024 | Best Practice , Technology | 0 Comments
Leveraging AI and the data layer in bidding and proposals
by Nyree McKenzie | January 11, 2024 | Best Practice , Technology , Trends | 0 Comments
Artificial Intelligence (AI) is transforming bid and proposal management, turning a traditionally human-centric process into one driven by data and efficiency. However, successful AI integration in bidding requires a robust data infrastructure, ensuring data accuracy, consolidation, security, and accessibility. It involves strategic planning, continuous monitoring, and fostering a culture of innovation. While AI presents significant benefits, it is crucial to adhere to ethical guidelines, ensuring its responsible use. As the bidding landscape evolves, businesses that strategically implement and manage AI will stay ahead of the curve.
Leveraging deep domain expertise with foundational models for optimal content curation in bidding
by Nyree McKenzie | August 4, 2023 | Best Practice , Technology | 0 Comments
In the world of bidding, AI like OpenAI’s ChatGPT has emerged as a game-changer. However, the effectiveness of these tools greatly depends on the quality of the prompts used. Learn why ‘dumb AI prompting’ can fall short and how leveraging deep domain expertise can lead to smarter prompts, optimised bid responses, and improved business outcomes.
The dangers of bidding for everything: Risks to businesses and customers
by Nyree McKenzie | July 21, 2023 | Best Practice | 0 Comments
Bidding for every opportunity without careful consideration can lead to significant risks for businesses. Diluting expertise, inadequate preparation, financial strain, reputation damage, and customer dissatisfaction are potential consequences. Learn from real-world examples like CGI Federal, IBM Australia, and G4S to understand the pitfalls of bidding without proper resources and expertise. Discover best practices to make informed “no bid” decisions and protect your business’s reputation.
The Business Case for Bid Management Software
by Nyree McKenzie | July 4, 2023 | Best Practice | 0 Comments
Crafting a compelling business case for bid management software implementation is crucial for driving your organisation’s digital bid transformation. Explore the key considerations, pain points, and growth opportunities that bid managers can leverage to demonstrate the value and benefits of adopting bid management software. From addressing inefficiencies to showcasing competitive advantages, learn how to unlock growth and profitability through streamlined bidding processes.
What makes a good Bid Manager?
by Nyree McKenzie | December 2, 2022 | Best Practice | 0 Comments
For organisations where bidding plays a large part of how they secure and maintain customers and contracts, Bidhive helps them quickly compile their bid teams, allocate tasks, set decision gates and build on the success of their previous bids.
How to win a government contract
by Nyree McKenzie | November 14, 2022 | Best Practice | 0 Comments
The Importance of Non-Price Criteria in a Tender
by Nyree McKenzie | November 9, 2022 | Best Practice | 0 Comments
When submitting a bid, it can be tempting to focus solely on price. Non-price criteria – or quality requirements – are increasingly taken into consideration when contracts are awarded.
We use third-party analytics cookies to understand how you use our website so we can build better products.
7 ways to present KPIs that your management team will love

Published 2016-07-18 , updated 2023-09-27

Summary - Everyone procrastinates on KPI reporting-why? Because it’s time consuming, tedious and the final product is often uninspiring. Putting together a good KPI report that your management team will not only love, but actually look at, doesn’t have to take as long as you think.
Everyone procrastinates on KPI reporting —why? Because it’s time-consuming and tedious, and the final product is often uninspiring. But KPIs are important ! While reporting is absolutely necessary for data-driven businesses , there’s a huge difference between raw data and insights. Putting together a good business KPI report that your management team will not only love but actually look at doesn’t take as long as you think.
What should be included in a KPI report?
How you present information, reports, and opinions determines how it is received. A good KPI report should be accessible, interactive, and transformable in under 10 minutes. A great report has these qualities in addition to a clear objective. Your objective is supported by your key insights that show how you are performing. Your KPI report should effectively communicate your objective and insights to everyone in your organization. This is why knowing how to define your organization's KPIs is so important.
How do I create a KPI report?
When you track your KPIs on a business dashboard in PowerMetrics , reporting becomes a quick, everyday task that will improve your team’s results and internal communication.
How do I present a KPI report?
Common ways to present KPIs to managers and executives:
- Share an email report with KPIs
- Distribute a PDF that shows KPIs
- Present KPIs using a slide presentation
- Display KPIs on a TV dashboard
- Visualize KPIs using a KPI dashboard
- Share KPIs using mobile reports or dashboards
- Build your own KPIs using dashboard software

1. Presenting KPIs in an email report
Email reporting makes a KPI report widely accessible across devices such as a smartphone, tablets, and desktops.
Email your KPI report in mobile-friendly formats such as PDFs or embedded images. A key benefit of email reporting is that users don’t need to download an external application to access KPI data, and visualizations appear in email reporting the exact same as on a business dashboard .
Automatically email a KPI presentation
S et up scheduled email reporting, and your team and management will automatically have your KPI report in their inboxes. Email is the most common KPI report communication channel. Connecting your business dashboard to email is easily accessible. An email KPI presentation decreases the amount of time spent creating a KPI report while increasing the amount of time management spends reading the update.
Email a KPI report in an instant
Email KPI reporting is great for one-time use and on-demand KPI reporting. When your manager or CMO asks you, “How’s our current marketing campaign performance?” or “What are our lead numbers this month compared to last?” Now you have a KPI report at your fingertips to share with your leadership team. Performance insights are extremely valuable and, when asked for an update, often require immediate attention. Pausing your day to gather data and create a KPI report distracts you from the time that should be spent improving your performance. Email KPI reporting quickly shares these insights quickly and efficiently. Learn more about the digital marketing KPIs that your business should be tracking.

2. Turn your KPI presentation into a PDF report
PDFs are a great way to present KPI reports because they maintain a clean and organized format for web, email, and print. PDFs are arguably the best reporting tool for print because it presents your KPIs based on how they appear on your dashboard .
Users have the ability to adjust the layout, size, height, annotations, quality, and style for each KPI report. Formatting can be time-consuming when you create a KPI presentation because, when done manually, you have to extract the data from its source and create visualizations to communicate your key insights. Also, consider adding custom branding options to capture your attention and provide additional context.

3. Create a KPI report slide presentation
A KPI presentation or slide deck encourages conversation . Turn your PowerPoint or Google Slides into a KPI presentation. A KPI presentation in PowerPoint is a visual representation of your KPI story. A KPI presentation should include minimal text and be about showing your progress with visualizations and data.
A common rule of thumb for a KPI presentation in PowerPoint or Google Slides is five words per line and five lines per slide. For this reason, images are important to include for a good KPI presentation. Visualizations make it easy for management to quickly understand KPI data while you present insights and everyone plans responsive action.
How do you show KPIs in a presentation?
When you present KPIs to a group where time is limited, strong visuals keep everyone engaged and on topic. KPIs work together and should be discussed in relation to one another. Best practice suggests no more than two images per slide if you are including text. And no more than four images if there is no text. If your KPI presentation has a slide for each KPI, I’d recommend noting the KPIs relation to others and the overall business objectives.
Discuss KPIs with managers with a business dashboard slide presentation
Incorporating data from KPIs and metrics into presentations adds an important layer of context when discussing your business. Executives always get inspired when seeing a concise version of their data and discover that they can use it in key decision-making. An executive dashboard slide presentation can effectively convey this information to your management team.
After your dashboard-driven KPI presentation, execs will request that you create more data visualizations on topics of interest to them. By sharing the interactive executive dashboard , you can keep the conversation going and prevent your KPI presentation from withering away in PowerPoint purgatory.
4. Present your KPIs on a KPI dashboard
What is a KPI dashboard? A KPI dashboard displays your KPIs in dynamic, interactive visualizations like charts and graphs. When you measure your KPIs on a dashboard, it ensures your data is up to date, and you’re always using the latest insights to evaluate your progress towards achieving your KPIs.
There is no set time of week, month, or year to make a KPI report. The best reporting is done every day . KPI dashboards make reporting an easy, daily habit so that you and your team can be transparent and data-driven.

5. Combine live links and wallboards for an easy everyday KPI report
Live links are ideal for users who: use wallboards to display one dashboard, to share a dashboard with a broader group within their organization, or to share with external users. Klipfolio users can publish a dashboard (with or without a password) as a shareable link.
Live links for your KPI presentation
Live links (published links) give everyone access to the data in an easy way, anytime. Live links allow multiple people to view your KPI dashboard. For organizations that track KPIs for clients , this is especially useful as it streamlines the line of communication.
Foster teamwork with your KPI presentation on a wallboard
Live links mirror KPIs from your business dashboard, so they are continuously updated. Allocating time to create dashboards with the KPIs your executives request in their end-of-month KPI report will simplify the reporting process and create the habit of monitoring these metrics at all times, not just at month-end. Another great benefit of wallboards is that they foster teamwork in the workplace. Get everyone in the organization to talk about performance and prompt questions from other departments.
Using wallboard to display a dashboard is a great way to keep performance metrics at the forefront of your team's mind. Displaying your dashboards on a wallboard demonstrates the significance of these KPIs to your entire team and others within the organization so everyone’s in the know. For example, Salesforce dashboards are popular to display on TVs.

6. Grant direct KPI dashboard access
Make your KPI dashboards accessible to everyone on your team. Users can be added to your Klipfolio account as an admin, editor, or view-only. All of these roles are capable of viewing the dashboard, however, each has specific permissions. The benefit of direct access is that you can set up role-specific dashboards.
Granting your team members, especially management, with access to your dashboards is an accessible way to present KPIs. Individuals can access KPI report data at all times without going through the long line of communication to reach the administrator. Direct dashboard access improves communication and demonstrates the value of your team’s efforts to management, as well as key areas for improvement.

7. Take your data everywhere with a mobile KPI presentation
C-suite executives are often on the road and require quick access to the status of their company’s performance. Presenting KPIs for management to access on their smartphone makes it simple for them to quickly access and understand data from anywhere. When everyone in an organization is given access to dashboards, data can be integrated into day-to-day activities.
Mobile KPI reporting becomes especially important as work-from-home and remote offices become increasingly common. You may not always be on your laptop, but the vast majority of people never forget their smartphone before leaving the house.
Add real data to every conversation with your mobile KPI report
With mobile reporting, KPI data becomes a natural and essential element of any business discussion. How many times have you been in a casual conversation with a colleague about work where you say, “I can show you when I get to my computer”? A mobile KPI report brings context by incorporating KPIs into the conversation, leading to a follow-up conversation or even immediate action.
This article was originally published in July 2016 and has been revamped and updated for accuracy.
- How to present a KPI report
- The basics of KPI management
- Starter guide to dashboard design
- What is a key performance indicator
- KPI Examples
Related Articles

How to write KPIs in 4 steps
By Emily Hayward — October 3rd, 2022

8 must-have metrics for your first digital marketing dashboard
By Emily Hayward — February 23rd, 2022

10 KPIs to monitor your digital marketing performance
By Emily Hayward — January 18th, 2022

The top 12 metrics for social media managers
By Emily Hayward — December 10th, 2021

- Strategy & Growth
How To Write KPIs
- juni 24, 2021
- by Maurice Remmé
Key performance indicators or KPIs are one of the most powerful tools in a business’s toolbox. As a measurable metric, KPIs demonstrate how well your business is performing against your strategic objectives. While KPIs are often interchangeably used with ‘metrics,’ they are much more than numbers. By tracking the performance of departments and individuals, you can make critical adjustments as needed in strategy execution to achieve your business objectives. In addition, these indicators help you break down strategic objectives into smaller, quantifiable data points.

Some KPIs are specific to certain sectors or industries, while others are exclusive to certain companies. The primary purpose of all KPIs is to measure progress towards the company’s short- and long-term goals.
KPI development is all about knowing what KPIs to measure and how to align them with your strategic objectives. This blog post takes a closer look at the KPI description, benefits of performance indicators, and the steps to creating effective KPIs.
What are KPIs?
KPI’s are short for ‘Key Performance Indicators’ and are measurable values that indicate whether the strategic objectives are achieved.
KPIs help each department or individual in a company monitor, track, and analyze their performance using specific metrics. For instance, the sales department tracks the number of sales calls while the digital marketing team evaluates metrics such as website traffic, social media engagement, or conversion rates.
For KPIs to be effective and meaningful, they require alignment with the strategic objectives of the business. These indicators allow business owners to get an overview of the performance of individual departments, employees, and their company on the whole at any given time. With quantifiable data, the KPI helps a business track its goals over a specific period.
KPI examples
Not every KPI, however, measures the business’s overall performance. Larger corporations typically have multiple KPIs for each segment or department.
Here are some KPIs related to customer service:
- Customers acquired over a specific period
- Footfall at the retail store
- Percentage of customers who made a repeat purchase in a specified timeframe
- Customer acquisition cost
- Customer retention
- Customer lifetime value
- Customer satisfaction score
- Net promoter scores (that indicate if customers would recommend your company to others)
- Customer support tickets
- Resolution or response times
- The number of calls received by customer service
- Customer complaints received via email
Examples of Digital Marketing KPIs
- Monthly Website Traffic
- Qualified Leads
- Conversion Rate
- Click-through-rate
- Subscriptions or app/ebook downloads
- Engagement with blog posts
How KPIs benefit organizations
Key performance indicators have a vital role to play in business success. While they are not business objectives or company goals themselves, they help businesses track their goals and targets. For instance, if a company’s goal is to boost sales of their products each month, KPI’s will show how far or close they are from reaching these targets.
A KPI metric that can be used to achieve this objective could be monthly lead generation. For example, if the metric indicates that the sales team generates 25 percent of the target leads, the manager can look into the reason for not achieving the target.
One of the most important benefits of KPIs is that they enable you to track progress and see where you are deviating. Tracking progress helps you make the necessary course correction to achieve your goals faster.
While this is the primary reason for using KPIs, their benefits extend to other realms.
Research from Gallup shows that for employees, knowing ‘what is expected of them at work’ is the key factor that boosts engagement at work. Employee engagement is linked to increased productivity, reduced absenteeism, higher employee retention, and overall better performance. KPIs clarify performance expectations across all levels for teams and individuals in the company, which can help boost employee engagement and motivation levels.
These indicators help communicate your expectations to all stakeholders clearly and unambiguously. Involving the stakeholders in KPI development assists in securing their buy-in and aligning them with the overall objectives. As a result, everyone in the company knows and agrees with the desired level of performance and what is unacceptable.
KPIs provide information on how successful each individual, and the organization as a whole, is in achieving a strategic objective. For instance, tracking the metrics on sales volume per month helps understand whether the revenue targets are being met.
On the other hand, if a goal was not reached, the metrics used to measure KPIs can help you understand why it was not achieved.
- Was the goal too high?
- Were there knowledge gaps?
- Did managers face difficulty in streamlining the sales process?
KPIs enable objective measures of employee performance that are ‘data driven’ rather than based on unconscious bias or guesswork. Metrics show the actual results achieved against ambiguous criteria such as ‘being busy’ or working for long hours.
What gets measured also gets done. Employees who have multiple tasks to handle are able to prioritize their work when they know which tasks matter the most.
What are lagging and leading KPIs?
Leading KPIs track performance before the process or outcome starts to follow a trend. Leading KPIs predict trends or changes and are forward-looking in nature. These are used to manage the process or system’s performance. Also described as inputs, leading indicators define what actions the business needs to take to achieve its goals.
While not accurate all the time, leading KPIs help set a benchmark for the company, such as:
- Increase in annual subscriptions
- Number of website visitors
- Percentage growth in market share
- Number of customers who purchase software products
Lagging KPIs measure the trend that a process or business has followed or the business’s actual performance. Lagging indicators show how well the system or process was managed.
A lagging indicator can help business stakeholders understand the current performance, such as:
- How many managers attended the corporate event?
- How many products were manufactured in the year?
- What was the annual net income in 2021?
Both these indicators work in tandem to help businesses understand present conditions and future trends. In addition, these metrics show whether the company is on track to meet its objectives. Another approach to rethink KPIs is to look at the threats from competitors and disruptors and the opportunities from developing customer needs, product features, and capabilities introduced.
Steps to follow to write effective KPIs

Step 1 – Identify your organization’s strategic objectives
Writing effective KPIs begins with an in-depth understanding of your organization’s strategic objectives. These objectives are measurable, have a defined timeframe, and specific. For instance, a company’s financial objectives may be to:
- Boost gross revenue to $5m by January 30, 2022
- Increase net profit by 30 percent by June 31, 2023
- Build reserve working capital of $1 million by December 31, 2024
- Decrease overhead spending by $10,000 by 1 st of January 2022
Growth objectives can include
- Expand business intelligence team by 2022 to five members
- Enter three new overseas markets over the next three years
- Capture 25 percent of regional market shares by 2022
- Open eight new locations in the next five years
- Increase product options from 6 to 10 by December 31, 2022
- Increase conversion rate by 10 percent by January 1, 2022
Customer service objectives examples
- Improve customer satisfaction
- Decrease product returns by 25 percent by January 1, 2022
- Increase net promoter score by 45 percent by October 1, 2021
- Reduce response time by 30 percent to complaints
- Boost returning customers by 50 percent by 2023
- Win an industry award by January 1, 2024, for customer service excellence
If you haven’t yet formulated strategic objectives, you can go through our blog post on ‘How to develop strategic objectives and strategic focus areas.’
Step 2 – Define the criteria for success
Once you have identified your company’s strategic objectives, reflect on what criteria define the success of each of these objectives.
For instance, achieving the strategic objective of boosting gross revenue to $5m by January 30, 2022, will entail:
- Increasing the customer base
- Increasing transaction size (each customer purchases more).
- Increasing the per customer frequency of transactions (encouraging people to purchase more often.)
- Boosting overall yearly sales
- Cutting down overheads
This example shows that each objective can involve multiple components that determine the success of the overall objective. For example, to boost revenue, growing the customer base, increasing transactions, cutting down overheads, and increasing the frequency of transactions are all important.
Meaningful performance measures can only be set when the objectives are clearly worded and measurable.
Step 3: Develop key performance questions
Developing essential KPQs (key performance questions) can help you determine how to meet a specific objective. Avoid close-ended (yes-or-no) questions and ask thought-provoking, open-ended questions to create meaningful KPIs.
Here are some obvious examples of KPQs:
- What’s most important to the organization?
- Where is value really created?
- What result or outcome do we want to achieve?
- Why is that result or outcome important?
- How can we define progress?
- How do we want to measure that?
- What kind of performance leads to those kinds of outcomes?
- How will we know when we have achieved the end goal?
Step 4- Collect supporting data
Before you decide what measures you will use to track performance, it is important to identify the information you have currently and gather additional supporting information. Depending on the industry or the strategic objective, the additional information you need could be competitor analysis, demographics, industry trends, conversion rates, and other data.
As each business is unique, what works for your competitor may not work for you. Therefore, dedicate time to understand what measures will benefit your company.
Step 5: Determine what to measure and how frequently you should measure
In this step, you will need to decide what KPIs are best suited for your strategic objectives. Effective KPIs trickle all the way from your overall strategic goals to the daily operations of individual employees for whom you are writing the KPIs.
Each KPI should also relate to a specific strategic objective. Asking these questions can help you create effective KPIs:
- What measures are best suited to indicate progress towards achieving an objective?
- Are these measures quantifiable?
- Is there a standard format to capture the metric?
- Are the measures realistic and time-bound?
In many cases, there can be more than one method of measuring your goals. For example, for the objective” Increase customer satisfaction,” the measures you can use include:
- Boost net promoter score
- Increase the percentage of satisfied customers
- Reduce product returns by X percent
Similarly, if the strategic objective is to boost gross revenue, the metrics can be:
- Monthly sales growth
- Average profit margin
- Sales closing ratio
- Average purchase value
- Lead conversion rate
- Sales per representative
For an e-commerce company that is looking to increase the conversion rate by 10 percent by 2022, some measures include:
- Conversion rate
- Cart abandonment rate
- Cumber of visitors to the company site
- Bounce rate
The decision to select specific measures over others may relate to its:
- Relevance or link to strategic objectives
- The time needed to gather data and
- The budget allocated (customer satisfaction index can require a detailed survey that can be more expensive than tracking the percentage of happy customers)
However, the main criterion in picking the metrics is to ensure the KPI is aligned with a strategic objective.
While there are multiple ways to measure the goals, not all of them need to be tracked, having too many KPIs to track can be time-consuming, counterproductive, and complicate the performance evaluation process.
For instance, if an organization’s strategic objective is to improve its employee training programs, the measures can include the percentage of employees trained and the training time. However, neither of the measures correlate with the result the organization seeks, which is developing people’s skills. A better measure is to track reduction in errors or delays as a result of the training program.
Step 5: Develop the KPIs.
Remember that KPIs must be SMART in nature (Specific, Measurable, Actionable, Relevant, and Time-bound) to be effective.
Unlike most other objectives that do not meet the SMART criteria, these characteristics are inherent in KPIs:
- Specific – it must be specific to an area as its linkage to a process, functional area, or preferably an objective.
- Measurable – it must be measurable; otherwise, it won’t indicate anything
- Assignable – unless the KPI is assigned, it will not be measured
- Realistic – setting realistic targets is fundamental in the documentation and use of KPIs.
- Time – it is implied in the measurement process
So, a KPI shouldn’t even be called KPI if it does not meet these criteria. For this reason, the term SMART KPI is in a way doubling up on the SMART criteria and should denote the most relevant KPIs as organizations track hundreds of measures; only a limited number qualify as “key measures.”
The criteria for SMART KPIs are:
- Being recommended for their usefulness in academic and practitioner publications
- Frequency of use across functional areas and Industries
- Fulfillment of the criteria of how good KPIs should be defined and used.
Answer these questions before you write the KPIs:
- What is the desired outcome?
- How will you measure progress?
- Who is responsible for the outcome?
- What criteria indicate achievement of the outcome?
- How often will the progress be tracked?
- Are the KPIs easily quantified?
- Does this KPI align with the strategic objective?
- Is it simple and easily understandable?
- Is it easy to measure?
- Can you measure the KPI in an accurate and timely manner?
- Will it be relevant to the company in the future?
The key to the KPI’s effectiveness is in its simplicity. It’s essential for everyone in the organization to be aware of the expected outcomes and how you measure and how often you measure progress towards the objectives. This is important not only for those who have ownership of these performance indicators but also for people across different levels in the company.
Communicating the organization’s vision, mission, strategic objectives, and KPIs to all relevant stakeholders is crucial to secure their buy-in.
Well-designed KPIs make it possible for all employees to understand how their work influences progress toward accomplishing organizational goals. Everyone gets clarity on where and how their work aligns with the strategic objectives that motivate them to achieve them. They will also see opportunities for improving efficiency, collaboration, and helping their teams meet collective targets.
Want to read more information like this? Subscribe to our newsletter!
We will send you the latest news and updates straight to your inbox. And we promise not to spam you.
Don't miss any updates
Want to know more about this blog topic.
Our business sparring service is a great way to discuss your ideas and challenges to support your decision-making processes.
Related Posts
Unveiling the link between financial product forecasting, target setting, and channel mix planning, unleashing leadership potential: navigating the journey from product manager to product management leader in managed services, navigating competitive price cuts in the automotive industry: strategies for success, is reageren op prijsverlagingen van een concurrent een must.

In the dynamic landscape of the automotive industry, staying ahead of the competition is crucial for sustainable growth. Tesla’s recent price reductions and strategic moves have sparked discussions about the importance of reacting to competitive price cuts. As decision-makers in the automotive, mobility, and car industry, it is essential to understand the implications and explore innovative strategies to navigate this changing landscape successfully.

How to balance your innovation budget and resources
Dedicating time and resources to innovation for your business is HARD yes – but here’s how we’ll remedy that situation

How to Develop Strategic Objectives and Strategic Focus Areas
Creating a strategic plan for a business is a challenging task, but it is an inevitable part of building a successful enterprise. A business without a well-laid-out strategic plan finds itself struggling to recover in times of crisis. On the other hand, as long as you have a plan, you have direction. To create a strategic plan that is easier to implement and stick to, you need to specify your strategic objectives and strategic focus areas. These are the pillars on which your strategic plan is built.

Hoe blijft de Europese automotive industrie relevant?
Met de aankondiging van Sixt dat er 100.000 Chinese elektrische auto’s aangekocht zijn bij BYD is het voor BYD mogelijk om een vliegende start te maken in de Europese markt met de levering van personenauto’s. Deze huurauto’s zullen worden ingezet in diverse Europese landen. De aankoop is in lijn met de doelstelling van Sixt dat de vloot in 2030 voor 70% tot 90% elektrisch is. Heeft de gevestigde Europese automotive industrie zelf meegeholpen aan dit scenario of zijn er andere factoren van toepassing?
- +31 (0)30 320 05 85
- [email protected]
- Paltzerweg 186 3734CN, Den Dolder
- Privacy Policy
- Terms & Conditions
- Privacy Policy
Home » How To Write A Proposal – Step By Step Guide [With Template]
How To Write A Proposal – Step By Step Guide [With Template]
Table of Contents

How To Write A Proposal
Writing a Proposal involves several key steps to effectively communicate your ideas and intentions to a target audience. Here’s a detailed breakdown of each step:
Identify the Purpose and Audience
- Clearly define the purpose of your proposal: What problem are you addressing, what solution are you proposing, or what goal are you aiming to achieve?
- Identify your target audience: Who will be reading your proposal? Consider their background, interests, and any specific requirements they may have.
Conduct Research
- Gather relevant information: Conduct thorough research to support your proposal. This may involve studying existing literature, analyzing data, or conducting surveys/interviews to gather necessary facts and evidence.
- Understand the context: Familiarize yourself with the current situation or problem you’re addressing. Identify any relevant trends, challenges, or opportunities that may impact your proposal.
Develop an Outline
- Create a clear and logical structure: Divide your proposal into sections or headings that will guide your readers through the content.
- Introduction: Provide a concise overview of the problem, its significance, and the proposed solution.
- Background/Context: Offer relevant background information and context to help the readers understand the situation.
- Objectives/Goals: Clearly state the objectives or goals of your proposal.
- Methodology/Approach: Describe the approach or methodology you will use to address the problem.
- Timeline/Schedule: Present a detailed timeline or schedule outlining the key milestones or activities.
- Budget/Resources: Specify the financial and other resources required to implement your proposal.
- Evaluation/Success Metrics: Explain how you will measure the success or effectiveness of your proposal.
- Conclusion: Summarize the main points and restate the benefits of your proposal.
Write the Proposal
- Grab attention: Start with a compelling opening statement or a brief story that hooks the reader.
- Clearly state the problem: Clearly define the problem or issue you are addressing and explain its significance.
- Present your proposal: Introduce your proposed solution, project, or idea and explain why it is the best approach.
- State the objectives/goals: Clearly articulate the specific objectives or goals your proposal aims to achieve.
- Provide supporting information: Present evidence, data, or examples to support your claims and justify your proposal.
- Explain the methodology: Describe in detail the approach, methods, or strategies you will use to implement your proposal.
- Address potential concerns: Anticipate and address any potential objections or challenges the readers may have and provide counterarguments or mitigation strategies.
- Recap the main points: Summarize the key points you’ve discussed in the proposal.
- Reinforce the benefits: Emphasize the positive outcomes, benefits, or impact your proposal will have.
- Call to action: Clearly state what action you want the readers to take, such as approving the proposal, providing funding, or collaborating with you.
Review and Revise
- Proofread for clarity and coherence: Check for grammar, spelling, and punctuation errors.
- Ensure a logical flow: Read through your proposal to ensure the ideas are presented in a logical order and are easy to follow.
- Revise and refine: Fine-tune your proposal to make it concise, persuasive, and compelling.
Add Supplementary Materials
- Attach relevant documents: Include any supporting materials that strengthen your proposal, such as research findings, charts, graphs, or testimonials.
- Appendices: Add any additional information that might be useful but not essential to the main body of the proposal.
Formatting and Presentation
- Follow the guidelines: Adhere to any specific formatting guidelines provided by the organization or institution to which you are submitting the proposal.
- Use a professional tone and language: Ensure that your proposal is written in a clear, concise, and professional manner.
- Use headings and subheadings: Organize your proposal with clear headings and subheadings to improve readability.
- Pay attention to design: Use appropriate fonts, font sizes, and formatting styles to make your proposal visually appealing.
- Include a cover page: Create a cover page that includes the title of your proposal, your name or organization, the date, and any other required information.
Seek Feedback
- Share your proposal with trusted colleagues or mentors and ask for their feedback. Consider their suggestions for improvement and incorporate them into your proposal if necessary.
Finalize and Submit
- Make any final revisions based on the feedback received.
- Ensure that all required sections, attachments, and documentation are included.
- Double-check for any formatting, grammar, or spelling errors.
- Submit your proposal within the designated deadline and according to the submission guidelines provided.
Proposal Format
The format of a proposal can vary depending on the specific requirements of the organization or institution you are submitting it to. However, here is a general proposal format that you can follow:
1. Title Page:
- Include the title of your proposal, your name or organization’s name, the date, and any other relevant information specified by the guidelines.
2. Executive Summary:
- Provide a concise overview of your proposal, highlighting the key points and objectives.
- Summarize the problem, proposed solution, and anticipated benefits.
- Keep it brief and engaging, as this section is often read first and should capture the reader’s attention.
3. Introduction:
- State the problem or issue you are addressing and its significance.
- Provide background information to help the reader understand the context and importance of the problem.
- Clearly state the purpose and objectives of your proposal.
4. Problem Statement:
- Describe the problem in detail, highlighting its impact and consequences.
- Use data, statistics, or examples to support your claims and demonstrate the need for a solution.
5. Proposed Solution or Project Description:
- Explain your proposed solution or project in a clear and detailed manner.
- Describe how your solution addresses the problem and why it is the most effective approach.
- Include information on the methods, strategies, or activities you will undertake to implement your solution.
- Highlight any unique features, innovations, or advantages of your proposal.
6. Methodology:
- Provide a step-by-step explanation of the methodology or approach you will use to implement your proposal.
- Include a timeline or schedule that outlines the key milestones, tasks, and deliverables.
- Clearly describe the resources, personnel, or expertise required for each phase of the project.
7. Evaluation and Success Metrics:
- Explain how you will measure the success or effectiveness of your proposal.
- Identify specific metrics, indicators, or evaluation methods that will be used.
- Describe how you will track progress, gather feedback, and make adjustments as needed.
- Present a detailed budget that outlines the financial resources required for your proposal.
- Include all relevant costs, such as personnel, materials, equipment, and any other expenses.
- Provide a justification for each item in the budget.
9. Conclusion:
- Summarize the main points of your proposal.
- Reiterate the benefits and positive outcomes of implementing your proposal.
- Emphasize the value and impact it will have on the organization or community.
10. Appendices:
- Include any additional supporting materials, such as research findings, charts, graphs, or testimonials.
- Attach any relevant documents that provide further information but are not essential to the main body of the proposal.
Proposal Template
Here’s a basic proposal template that you can use as a starting point for creating your own proposal:
Dear [Recipient’s Name],
I am writing to submit a proposal for [briefly state the purpose of the proposal and its significance]. This proposal outlines a comprehensive solution to address [describe the problem or issue] and presents an actionable plan to achieve the desired objectives.
Thank you for considering this proposal. I believe that implementing this solution will significantly contribute to [organization’s or community’s goals]. I am available to discuss the proposal in more detail at your convenience. Please feel free to contact me at [your email address or phone number].
Yours sincerely,
Note: This template is a starting point and should be customized to meet the specific requirements and guidelines provided by the organization or institution to which you are submitting the proposal.
Proposal Sample
Here’s a sample proposal to give you an idea of how it could be structured and written:
Subject : Proposal for Implementation of Environmental Education Program
I am pleased to submit this proposal for your consideration, outlining a comprehensive plan for the implementation of an Environmental Education Program. This program aims to address the critical need for environmental awareness and education among the community, with the objective of fostering a sense of responsibility and sustainability.
Executive Summary: Our proposed Environmental Education Program is designed to provide engaging and interactive educational opportunities for individuals of all ages. By combining classroom learning, hands-on activities, and community engagement, we aim to create a long-lasting impact on environmental conservation practices and attitudes.
Introduction: The state of our environment is facing significant challenges, including climate change, habitat loss, and pollution. It is essential to equip individuals with the knowledge and skills to understand these issues and take action. This proposal seeks to bridge the gap in environmental education and inspire a sense of environmental stewardship among the community.
Problem Statement: The lack of environmental education programs has resulted in limited awareness and understanding of environmental issues. As a result, individuals are less likely to adopt sustainable practices or actively contribute to conservation efforts. Our program aims to address this gap and empower individuals to become environmentally conscious and responsible citizens.
Proposed Solution or Project Description: Our Environmental Education Program will comprise a range of activities, including workshops, field trips, and community initiatives. We will collaborate with local schools, community centers, and environmental organizations to ensure broad participation and maximum impact. By incorporating interactive learning experiences, such as nature walks, recycling drives, and eco-craft sessions, we aim to make environmental education engaging and enjoyable.
Methodology: Our program will be structured into modules that cover key environmental themes, such as biodiversity, climate change, waste management, and sustainable living. Each module will include a mix of classroom sessions, hands-on activities, and practical field experiences. We will also leverage technology, such as educational apps and online resources, to enhance learning outcomes.
Evaluation and Success Metrics: We will employ a combination of quantitative and qualitative measures to evaluate the effectiveness of the program. Pre- and post-assessments will gauge knowledge gain, while surveys and feedback forms will assess participant satisfaction and behavior change. We will also track the number of community engagement activities and the adoption of sustainable practices as indicators of success.
Budget: Please find attached a detailed budget breakdown for the implementation of the Environmental Education Program. The budget covers personnel costs, materials and supplies, transportation, and outreach expenses. We have ensured cost-effectiveness while maintaining the quality and impact of the program.
Conclusion: By implementing this Environmental Education Program, we have the opportunity to make a significant difference in our community’s environmental consciousness and practices. We are confident that this program will foster a generation of individuals who are passionate about protecting our environment and taking sustainable actions. We look forward to discussing the proposal further and working together to make a positive impact.
Thank you for your time and consideration. Should you have any questions or require additional information, please do not hesitate to contact me at [your email address or phone number].
About the author

Muhammad Hassan
Researcher, Academic Writer, Web developer
You may also like

Grant Proposal – Example, Template and Guide

How To Write A Business Proposal – Step-by-Step...

Business Proposal – Templates, Examples and Guide

How To Write A Research Proposal – Step-by-Step...

Proposal – Types, Examples, and Writing Guide

How to choose an Appropriate Method for Research?
Track. Measure. Grow.
An Insider’s Guide to RFP Metrics That Matter
A guide for proposal teams who want to make smarter decisions, win more RFPs, and elevate their work.
Here’s what you’ll learn
Ready to get started download your rfp analytics template., table of contents.
1. What Are RFP Metrics?
2. How to Track RFP Volume
3. Tracking RFP Revenue
4. Measuring the RFP Process
5. Improving RFP Content
6. The People Behind RFPs
7. Using Each Proposal Metric
8. Setting Up Your Process
RFP Analytics Template
Like a trusted advisor, request for proposal (RFP) metrics exist to guide your decisions. They offer insight into what’s working, what’s not, and your top opportunities to improve. But just because you can measure something, doesn't mean you should. That’s why this guide focuses on teaching you how to track the 22 RFP metrics that actually matter. It shares everyday insights—like the number of RFPs submitted—to advanced metrics, including team bandwidth or proposal progression forecasts. You’ll learn how to make small improvements to your daily work, position yourself as a strategic revenue driver, and, ultimately, advance your career.

Chapter 1. What Are RFP Metrics?
RFP metrics are the numbers you can track to better understand how your RFP program is performing. For example, of the RFPs you send, how many do you win? Or of your contributors, how many get their submissions in on time, and how often?
There are five groups of RFP tracking metrics:
Each can tell you something different and specific about your work and proposal program.
But regardless of which RFP metrics you’re after, there are general principles that apply across all. In this chapter, we’ll help you select metrics that’ll form the foundation of your RFP analytics.
How to Select Your RFP Metrics
The first step in collecting good RFP data is to confirm the goals of your program. To drive revenue, yes, but you can be more specific. Is your revenue goal S.M.A.R.T?
S – Specific
M – Measurable
A – Attainable
R – Realistic
T – Time-bound
When setting goals, think about the outcomes that you want to achieve. Do you want to submit all RFPs on time? Do you want the RFP team members to thrive and grow in their roles? Do you want to retain a significant number of existing clients? Answer these questions when writing down your final goals.
1. Set RFP Program Goals
Now that you know what you want to achieve, make sure to incorporate a mix of short-term goals for your department, as well as long-term goals that contribute to the business.
It’s important to differentiate between departmental goals and those of the broader business to keep your team satisfied. The reason: If your team can’t affect some of those goals, but they’re still held to them, they can feel demotivated.
This often happens with win rates. Winning is so dependent upon the skills of a salesperson that it’s difficult for proposal teams to carry the full responsibility of that metric alone.
Reference the chart above and include a mix of both goals for balance. Look at departmental goals to identify what you and your team can change. Look at business goals to tell you what the company needs to change. Both should be used to achieve RFP success.
2. Different Types of Proposal Metrics
With your goals in hand—those primary things you want to achieve—generate a list of problems you need to solve to reach them. You can measure each problem with a metric found in this guide.
Build your list of the RFP metrics that, in an ideal world, you’d like to track because they provide answers that lead to data-driven decisions that can impact change.

Chapter 2. Tracking RFP Volume
Volume metrics form the baseline upon which other RFP metrics are built. They are something every organization should track, no matter how small they are, such as how many RFPs they receive and how many they complete.
While not particularly insightful when taken alone, volume metrics are very helpful when combined with other RFP metrics. For instance, knowing that you reply to 30 RFPs per year doesn’t tell you much. But knowing that you reply to 30 RFPs, with a team capacity of 25, suggests you are overworked. Those numbers help you make a data-driven case for more resources.
There are three volume metrics to track:
RFPs Received (#)
Rfps submitted (#), rfp participation rate (%).
This is the total number of RFPs your team receives over a period of time.
The volume puts all your other RFP metrics into context, especially those around workload, and it can reveal your velocity, which shows whether the rate at which you’re receiving RFPs is speeding up or slowing down.
✓ How to track it:
- Track volume automatically through an intake form
- Ideally, you’ll sync your form to a customer relationship management (CRM) tool
- Alternatively, you can keep track of this metric through Google forms and a spreadsheet
- Whichever method you use, add a dashboard that organizes by your short-term vs. long-term goals
✓ Decisions you can make with it:
- Determine whether RFPs are currently important to your business
- Determine whether the volume is increasing or decreasing (if tracked over time)
- Determine whether you have enough RFP pipeline (if tracked over time)
How many RFPs do companies normally receive?
According to Loopio’s 2021 RFP Response Trends & Benchmarks Report , which contains research from 650+ teams across North America, companies receive an average of 230 RFPs annually.
This is the number of RFPs your organization responds to.
It helps you understand your team’s output, or how many proposal replies you’re sending. This metric is most helpful when compared to other workload metrics. For example, knowing that the number of RFPs submitted exceeds your team’s workload, which may demonstrate that you’ve been working overtime.
- Track the same way you track RFPs received—in a CRM like Salesforce
- You can also track by monitoring projects marked “100% complete” in a proposal software
- If you don’t have access to either of these tools, use a shared spreadsheet with your team
- Determine whether you’re responding to a healthy percentage of the RFPs you’ve received
- Determine if your team is overworked (if you know your team’s maximum workload)
- Determine if you need more resources (if this number is lower than your goal)
How many RFPs do companies submit?

Source: Loopio’s 2021 RFP Response Trends & Benchmarks Report
This is the percentage of RFPs you receive that you respond to.
This tells you how many of the RFPs you actually participate in. Or, how many proposals receive the “go” designation from a go/no-go process , a framework that helps RFP teams make quick decisions about which bids to respond to.
If you record why you decline each RFP, you’ll be able to look back at the reasons in aggregate to determine if your response rate is healthy for your business. If you find that many of the RFPs you declined weren’t a fit, your team doesn’t feel overworked, and you’re hitting your win-rate goal, your present participation level is probably a good benchmark.
- Divide RFPs received by RFPs submitted and multiply the result by 100
- You can set this up in a custom CRM dashboard, or in a pinch, use a spreadsheet
- Whether you’re responding to enough RFPs to meet your revenue targets
- Whether you need more resources (if this rate is low)
- Whether you need to alter your go/no-go standards
What is a normal RFP participation rate?
On average, companies participate in 65% of the RFPs they receive.

Chapter 3. Tracking Revenue (Thinking Beyond Win Rates)
Revenue can be a fraught topic in the RFP world. While your overall goal may be to drive revenue, tracking only that will cause you to miss all the work that goes into the submission. You can have a talented RFP org putting out quality work that still loses the majority of the time.
That’s because revenue metrics are a lagging indicator for proposal teams. You often don’t know you’ve succeeded at generating revenue until months later (or even a full year in some industries). For these reasons, it’s important to balance revenue insights with metrics that your team can impact now, like how efficiently your team prepares and delivers a proposal.
There are six revenue metrics we recommend tracking:
RFP Win Rate (%)
Shortlist rate (%), advancement rate (%), overall revenue from rfps ($), cost per bid ($), opportunity ratio (%).
This is the percentage of RFPs submitted that end up as part of a winning deal.
Your win rate is primarily a reflection of how successful the sales team has been at closing deals that involved a proposal. RFPs get you into the conversation and onto the list, but the sales team takes it the rest of the way. However, proposal teams should still keep a close eye on win rate, as Jon Williams from Strategic Proposals explains.
“CEOs and sales leaders employ us to help win business – but you can’t measure a proposal team on win rates alone. There’s so much more that influences the outcome. But imagine your win rate is zero: would that feel right? No! Win rate has to be a critical part of the mix.”

- In a CRM like Salesforce, run a report to see “deals won” with an RFP attached
- Then, divide the number of RFPs “won” by the total number submitted and multiply by 100
- You can also track the win rate through RFP response software . Simply mark winning projects as ‘won’ and the software automatically calculates your rate
- Predict how much revenue you can win (if your rate stays consistent)
- Determine who’s responsible for a revenue shortfall (if the win rate is low, the fault may lie outside of your team)
What is a good RFP win rate?
The average organization wins 47% of its RFPs, although win rates also tend to vary by company size. For example, enterprise companies win more frequently than small ones.

This is the number of RFPs submitted where you were shortlisted by the buyer.
Shortlist rate is a much more accurate measurement of RFP quality than RFP win rate. It’s a pure measure of RFP success—having read your proposal and those of your competitors, the buyer selected yours to move to the next stage of consideration, which is typically a demonstration from the sales team.
✓ How to measure it:
- In your CRM, create a deal stage indicating that the buyer shortlisted you for this opportunity
- As a backup, use a spreadsheet to track this metric
- Determine whether your team is achieving successful outcomes (irrespective of win rate)
- Determine whether your process needs work (if the shortlist rate is low)
- Identify the parts of your process that may need attention (if the shortlist is high but the win rate is low, the issue lies somewhere else in the process)
How to successfully track shortlist rate 💡
Collect this information actively, by making it a “deal stage” in Salesforce, rather than passively , by requiring sales reps to check a box. If they’re busy, they’ll forget, and it’ll throw off your number.

This is the percentage of RFPs that can move on to the next stage or “convert” for each stage in your RFP deal cycle.
Advancement rate (also known as progression rate) can show you how often your RFPs move to the next stage in the buying process. This metric is a wonderful opportunity to learn to speak the same language as your salespeople, as the stages should be drawn directly from, and map exactly to, their process (even if they have more stages).
When you measure these rates over time and establish benchmarks for your business, you can start to see where things fall off. For example, if the dropoff occurs right after the sales demo or interview, you can explore demo recordings for opportunities to improve.
Plus, the higher your conversions are from stage to stage, the fewer RFPs you need in your pipeline to achieve the same overall revenue. If your stages match the example below, and you know you have 150 RFPs for an average of $15,000 each, you can reasonably expect to win about $200,000 in revenue.
- Start by tracking how many deals progressed to the next stage over a time period
- Compare this number to how many were lost over the same period
- Then, divide that number by the total number of deals in the previous stage and multiply by 100 to calculate your advancement rate
- You can do this easily by creating the appropriate deal stages in your CRM. Then create a dashboard that displays the percentage of deals that progress between each stage
- Forecast RFP revenue (if you have accurate benchmarks)
- Identify issue areas in your RFP response or sales process
- Identify areas in your RFP response process where you can save time
“One metric that we’re doubling down on is our advancement rate. Our sales cycles are long, and it can take months after submitting the RFP before the customer makes a decision. But we can find out pretty quickly if we advance to the next round."

This is the total dollar value your organization has gained from deals involving an RFP.
It tells you how much revenue your RFP team is helping to generate. If taken as a percentage of total company revenue, it gives you a sense of the relative importance of proposals as a channel. Or, if the percentage of RFP revenue to total revenue is lower than the industry standard, it could be used to make a case for more resources.
- Add up the total dollar value of all the deals in your CRM that include an RFP
- To do this, you’ll need salespeople to mark which deals involved an RFP, or mark it yourself
- Once you’ve marked all the “deals won” that include an RFP, build a dashboard that showcases how much revenue you’ve influenced
- Make a case that your RFP program has more potential (if advancement rate is high, but win rate low)
- Whether the RFP team needs more resources

What’s the best way to track RFP revenue?
Just like the sales team tracking deals, your team should proactively measure your proposal pipeline. Use a CRM like Salesforce for a centralized approach to monitoring company revenue. And if you use proposal or due diligence software , you can sync those two tools together for easier reporting. For example: using the Loopio-Salesforce integration, run a report on opportunities tied to RFP projects—and see how much pipeline is tied to proposals.
This is how much it costs your organization to reply to an RFP, including time, materials, software licenses, and anything that goes into responding.
Knowing your cost per bid helps you calculate your return on investment (ROI) on responding to RFPs. If your cost per bid is $6,000 (not an unreasonable estimate), and the value of the RFP is only $6,000, you know not to respond because you’d likely only break even. Cost per bid also tells you how resource-efficient your team is.
Industry expert, Ben Klein , says the cost of the bid should be no higher than 5 percent of the value of the contract. In fact, you’re often looking for lower, in the 0.5 to 2 percent range.
- Calculate the cost of all your resources devoted to each bid, and add it all together
- Then, divide that number by the total bids (this gives you an average cost per bid)
- If you really want to be precise, track your cost per bid for different types of bids—for instance, the average cost of a government bid versus a private sector bid
- Determine if you can spend more resources on each RFP (if the ROI is high)
- Determine if you’re spending too many resources on each RFP (if the ROI is low)
"Calculating cost per bid drives more informed decisions. If a company is doing 50 submissions and each costs ten grand in resources, suddenly that’s a half-a-million-dollar budget. That gets people thinking differently."

This is the percentage of revenue you stand to gain after accounting for cost per bid.
This RFP metric estimates the relative reward of each RFP, and the higher the better. An opportunity ratio of 60 percent means on a $10,000 RFP, you would make $6,000 in profit. Knowing this helps you decide which RFPs to prioritize.
Let’s say you can only respond to one RFP, and you could either spend 15 hours on a $5,000 deal or 25 hours on a $200,000 deal. If you weigh the opportunity ratios, you’ll be able to make a clear decision and justify it to others. (And likely, you’ll pick the second one.)
- Subtract the cost per bid you’ve calculated from the total revenue for this opportunity
- Divide that difference—the amount you stand to gain—by the total revenue for this opportunity
- Finally, multiply by 100 and the result is your opportunity ratio percentage
- If you want to become even more accurate, you can factor in elements like the expected win rate based on opportunity characteristics (simply multiply the opportunity rate by the expected win rate)
- Decide whether or not to respond to an RFP
- Prioritize one RFP over another based on opportunity value
- Determine whether you need to be more efficient
- Decide that it’s time to end the cycle of reviews for the sake of cost

Chapter 4. Measuring the RFP Process
Process metrics allow you to explore the RFP process and identify areas where something isn’t working. For instance, if RFPs tend to be late, and you observe that time to second draft is twice as long as it was last quarter, that’s probably the area you need to investigate.
The challenge with process metrics is they tend to require added participation from everyone involved. It’s difficult to know if an individual subject matter expert replied on time unless they tell you, unless you track it yourself, or unless you have a bid software that captures it automatically.
There are five response process metrics to track:
- Number of Questions Completed Per RFP
Time to First Draft (#)
Time to second draft (#), overall writing time per rfp (#).
- Total Turnaround Time (#)
Number of Questions Per RFP (#)
This is the average number of questions you respond to per RFP.
This is a relative measurement of the length of the RFPs you respond to. Basically, it’s a proxy for how long an RFP will take and how much effort goes into it. Although every proposal contains varying levels of complexity, a benchmark estimate of time per question will help make better predict team resourcing in the long run.
- Load the RFP into your response software to track the number of questions automatically
- Alternatively, you can count manually in a spreadsheet (although it’ll take considerably more time)
✓ What decisions you can make with it:
- Decide how long an RFP will take to complete (and resource accordingly)
- Gauge the number of questions that can be answered through RFP response software through a library of past answers

How many questions does an RFP have?
The average RFP has 115 questions and takes approximately 23 hours to complete—which means the average question takes 12 minutes to answer. So the next time you receive an RFP, estimate how long it will take to write by multiplying 12 minutes per question.
This is the amount of time it takes your team on average to complete the first draft.
This RFP metric tells you (and everyone involved) how quickly your team turned around the first draft. Less time is not necessarily good unless it’s paired with results like a high shortlist rate. That’s because speeding through could cause you to cut corners and produce a response of lower quality. What you want here is a healthy number—not necessarily the lowest possible number—and one correlated with a high shortlist or win rate.
- Track how long it takes you to complete the first draft of an RFP
- You can do this automatically in an RFP or RFI software by tracking time elapsed between “project created” and the first draft being complete
- Alternatively, you can use a time tracking app like Toggl and record it in a shared spreadsheet.
✓ Decisions it will help you make:
- Whether you’re spending a healthy amount of time on the first draft
- Figure out what’s a normal timeline for your team
- Track what timelines correlate with a higher shortlist rate
How to track RFP timelines
It’s best to track this metric through a system that aligns with your team’s current process. For example, if you use RFP software , don’t ask your team to track time in a separate spreadsheet. Use functionality in that tool to minimize work (and provides less room for human error).

This is the total time that elapses between the first and second draft submissions.
Just like the time to first draft, time to second draft gives you a sense of whether your team is spending an appropriate amount of time on a project. One of the leading causes of response process delay is from subject matter experts and reviewers taking too much time on their part. One way to address this is by tracking the response times of subject matter experts. Offer them tools and easy methods to do this that hold everyone accountable.
- Track it automatically in your request for proposal software by monitoring the time elapsed between drafts
- Alternatively, ask your team to track time through CRM tasks or a project management tool like Asana
- As a last resort, track it in a spreadsheet
- Determine whether you’re spending a healthy amount of time on the second draft
- Determine whether second draft slowdowns are causing issues further down the line
- Helps you create SLAs (look at non-software specific terms for this) to safeguard your time and proactively communicate the performance of your department
“Give your SMEs as much time as humanly possible to answer questions. If I’m reviewing an RFP and I need their help, I’ll send them a message right away letting them know that I’ll be sending over questions to them later. My SMEs really appreciate the heads up so they can adjust their schedules.”

This is the average amount of time your team spends writing an RFP.
Long or short writing times aren’t necessarily bad—what matters is finding a number that’s healthy for your business and which leads to a high shortlist rate. If shortlist rates are low, you probably aren’t spending enough time writing RFPs.
- Ask your team to track time using RFP response software or a project management tool
- You may also track time spent writing new content—which should drop as you build your sales library of reusable answers
- To get a more precise calculation, you can also track the writing time for each question in an RFP
- Estimate how long an RFP will take to complete (if you know the average number of questions)
- Decide to spend more time writing RFPs (if win rates are low, and feedback from prospects mentions poor writing)
- Decide whether you need to automate more RFP responses to give writers more time per question
How much time does it take to answer an RFP?

Total Turnaround Time
This is the total time it takes to respond to an RFP, from notification to submission.
This helps you plan and resource your RFP responses. It’s the parent metric to others such as time spent writing and puts those RFP metrics into context. If your time spent responding to RFPs is relatively low—and so is your advancement rate—perhaps you should take more time. Or if more time isn’t possible, investigate how you might save time by eliminating unimportant steps, such as waiting for approvals.
- Track how much time each RFP takes from start to finish and take the average
- RFP response software does this automatically, but you can also manually track in a project management tool or spreadsheet
- Measure RFPs, RFIs, and DDQs separately (DDQs tend to be more repetitive, which could throw off your average)
✓ Decisions it helps you make:
- Determine consistency—if completion speed varies widely, you may have process issues
- Forecast whether you’ll be able to meet an RFP deadline before you take on the bid
- Estimate the time needed to reply to an RFP and establish SLAs for how much advance notice you need before the submission date
What’s the average RFP turnaround time?

RFP statistics show that the majority of teams are turning around proposals in less than 48 hours . Considering the average RFP involves 9 people, this is shockingly speedy.

Chapter 5. Improving Your RFP Content with Data
Highly effective proposal management teams know that clear, well-written answers lay the foundation for a successful proposal. This is why measuring the performance of your answers (a.k.a content) is critical.
Understanding where your content is performing well (and where it needs improvement) will help your team scale improvements across all proposals. To truly improve content through data, you’ll need a library of reusable responses that your whole team has access to.
There are four content metrics to track:
Content Usage (%)
Content freshness (#), content performance (%), content answer automation (%).
This is a measurement of how often specific answers are used (and reused) when responding to RFPs.
Content usage tells you what your most common and important answers are. If an answer is used in 90 percent of RFPs, and you’re trying to prioritize the time you plan to spend improving your library, that’s the place to start. Small improvements there can have a big effect on the overall program. Similarly, if some answers are never used, investigate why, and either rewrite or consider retiring them.
- Content usage rate is tricky to calculate unless you have an RFP response software that tracks which answers it fills in automatically
- You can count content usage manually in a spreadsheet, but be sure to note which RFPs each response appeared in
- Prioritize the answers that need updating
- Identify old answers that should be rewritten or retired
- Inform the greater team which products are of greatest interest based on how often they appear in proposals, plus how those trends are shifting

This is a measure of how recently an RFP answer has been reviewed or updated.
Content freshness can be an indicator of whether it’s safe to use an answer in your latest proposal. Every company has a different level of what’s considered healthy for content freshness, but a declining freshness score tells you that you’re writing more and more new answers for each proposal, which suggests that the ones in your library are out of date, or “stale.”
A score of zero means your library is completely stale. A score of 100 means it’s perfectly up-to-date. Make updating your content part of your review process or it’ll grow into a project so large nobody wants to tackle it.
✓ How to track it :
- This metric is difficult to track without an RFP response software to do it for you
- If tracking it in a spreadsheet, create a column next to each answer for recording how many times it was used. Divide that number by the total number of RFPs and multiply by 100
- Then, average the rate for all questions to create one overall score. When finished, mark the date of your last content review, so you’ll remember what was included next time you return
- Decide whether it’s time to update your content
- Decide whether to respond to industry changes (based on a declining freshness rate)
- Decide whether you need more resources (if tied with a declining selection or win rate)
The hidden benefit of content freshness
While this metric isn’t typically scrutinized by leadership, it does help solve for a very important mission: reducing legal risk. If your answers are stale, it could mean you’re about to put outdated information into the agreement, which could create a spiral of legal, privacy, and security issues. Fresh answers help ensure your answers stay compliant.
This metric can take several forms, but the most common is a bar graph showing the reported reasons for winning or losing RFPs.
Without win/loss insights, it’s difficult to know what to change after losing an RFP. You can track people’s responses by role to reveal disparities in how the teams work together. Qualtrics, the leader in experience management, sends surveys after each of its proposals to collect this data.
- Create a consistent feedback loop for your proposals (or at the very least, your priority deals)
- After a deal is marked as “won” or “lost” in Salesforce, trigger a request for feedback to the contacts involved
- For the highest-fidelity picture, gather data that covers all deals, but also spend the time to interview participants on qualitative insights
- Using a tool like Clozd can help streamline win/loss analysis
- Identify areas in your process to improve, such as pricing
- Identify individual questions that tend to perform well
- Identify individual questions that tend not to perform well
- Identify sections in the proposal that aren’t performing well. (For example, things your team consistently performs poorly on)
- If you track responses by role, identify areas of misalignment, and facilitate a dialog
How to gracefully gather feedback
- Ask three priority questions to help you improve—but no more. Be specific.
- Draft a post-RFP survey (or form) that’s easy to submit in a couple of minutes.
- It’s OK to politely follow up. People are busy, but usually, they do want to help.
Source: How to Answer RFP Questions , According to Procurement Pros
To collect broad win/loss data, send a survey after each RFP which asks, “Why did we win/lose this RFP?” and allows people to select multiple factors. Aggregate the responses over time to produce a bar graph. You can do this automatically in an RFP response software, or a survey tool. (Additionally, some organizations who evaluate your RFP may provide you with the scores they gave each of your questions—collect those in one place.)
To collect narrow data, proactively schedule interviews for after the deal closes, with both the salesperson and, if possible, with the client (separately). Use the opportunity to go deep and invite candid, unfiltered feedback. Cross-reference this information with your aggregate survey information. Do any of the rationales explain what you’re seeing in the survey?
“It’s best when the supplier approaches that opportunity to have a debrief as a learning opportunity, opposed to questioning the decision.”

This is a measure of how many of your RFP answers are automatically added to your proposal—that is, inserted by software, rather than you having to manually copy and paste.
An answer is considered “automated” if you can do one of the following:
- Auto-fill it in just a couple of clicks
- Find the answer by searching for it within one central answer library
- Automatically assign content updates, edits, and approvals to SMEs
- Auto-detect if the answer was up-to-date
- A proposal automation or response software will track this automatically
- If you’re using a spreadsheet to track it, keep a tally of how many of the answers you copy-and-pasted for each RFP, and divide that number by the total number of answers
- Be sure to track it over a period of time for an accurate average.
- Determine how much time your team is saving thanks to automation (and how much more RFP revenue that can lead to)
- Determine whether your investment in an RFP response software is paying off
- Determine whether your answer library is fresh enough (if the automation is low, it’s an indicator that freshness is below what it could be)
- Determine whether you need more resources (if the automation rate is declining, more writing is in your future)
Three signs you need answer automation
How do you know if you need RFP automation ? You meet these criteria.
- Do you answer 1 or more RFP per month?
- Do you work with 5 or more contributors?
- Is your average question repetition 40% or higher?
Proposal automation is a measure of your team’s effectiveness at eliminating busywork. If you have an automation tool into which you can input an RFP and have it fill out the answers for you, it’ll save time, reduces the cognitive burden of responding, and free you up for more strategic work that can’t be automated.
Long-term, automation can be your path to promotion. Individuals who systematize their work in a way that frees them to think strategically creates a path for advancement.

Chapter 6. The People Behind Your RFPs
People metrics are perhaps the most underestimated metric of RFP performance. There are two important things to know about measuring these outcomes. The first is that they should never be used to punish or blame. All that can do is lower morale. These metrics should only be used to suggest and guide.
Second, it’s important to track qualitative people metrics, too. Most RFP teams focus on the quantitative stuff—how long people took to respond, how many RFPs they touched, and more. But what about how contributors felt?
Without a sense of whether your SMEs are facing unforeseen roadblocks, there’s no understanding if their deadlines are realistic. Use people metrics to ask how they feel and give them a part in building a better RFP response process .
There are four people metrics to track:
Number of Collaborators (#)
Team satisfaction (%), team capacity (#).
- Forecasting Cost Savings ($)
This is the average number of collaborators that work on a single proposal response.
The number of collaborators can signify a few things about the efficiency (or inefficiency) of your process. There’s an ideal number for your business, above which, it’s too many people, and they’ll only work slower and produce lower quality work. And there’s a number below which you’re not getting a sufficient diversity of opinions, and the answers won’t be as accurate or specific.
- Track the total number of people who participated in each RFP, and take an average over a period of several months
- If you can, track who exactly contributed, their role, and even who contributed by question, so you can get a sense not only of how many people contributed, but why they were needed
- RFP software will track this automatically. A step-down option is tagging the appropriate people in a project management software or recording contributors in a spreadsheet
- Investigate whether the team is too small, or too large, in comparison to the volume of RFPs you produce
- Decide whether to set a limit on the maximum number of collaborators
- Decide who precisely needs to be involved in an RFP and resource appropriately
How many people does it take to complete an RFP?
The average RFP team involves nine collaborators. But team size also grows with company size, which is likely a reflection of the resources available to complete an RFP.

This indicates how satisfied team members are with your RFP process. Even more important, it shows you if they’re dissatisfied and why.
This RFP metric helps you understand whether your contributors will want to continue contributing. They may have responded to this one grudgingly and vowed to never do it again, and unless you’re collecting satisfaction, you won’t know. Conversely, by reminding contributors that the RFP program is a work in progress, that you value their opinion, and that you plan to act upon what you learn from satisfaction surveys, you can encourage them to put up with some frustration and be part of improving the process.
- Send surveys after each RFP and on a quarterly cadence using a survey tool like Google Forms, Typeform, or Qualtrics
- Determine how to improve your RFP response process for contributors
- Know when a contributor is upset so you can reach out and address the issue
- Understand how different parts of the RFP process lead to contributor satisfaction/dissatisfaction
Loopio’s 2021 Benchmarks Report uncovered an interesting correlation—spending more time on RFPs tends to make contributors happier because more time on a response tends to lead to winning. That validation can make all the effort worthwhile.
Remember: only measure if you can act on what you learn . Measurement is a tax on your collaborators. If you consistently ask why they’re dissatisfied, but don’t have any way of fixing those issues, you’ll break their trust, and make them more reluctant to participate.

Four questions to measure team satisfaction:
- Which department are you in?
- How much time did you spend on this RFP?
- How would you rate your experience with this project on a scale of 1 to 5?
- What would you change about the RFP process?
The amount of bandwidth that contributors have to complete an RFP.
This gives you a data-driven sense of how much capacity your team has, and whether you can take on more proposal projects. Knowing your capacity helps you set a start date and determine (based on total average response time) how long you’ll need—and whether you’re cutting it close.
There are two ways to track this metric. Either calculate it based on overall RFP team capacity or based on individual contributor capacity. Unless yours is a mature organization, we recommend starting with measuring team capacity—it’s simpler.
✓ How to measure RFP team capacity:
- In your CRM, input the number of RFPs your team can complete weekly and monthly
- Use a dashboard speedometer to show how you’re tracking against that number
- You can either calculate based on your team’s time or include other departments, like IT or legal
✓ How to measure individual contributor capacity:
- Track the number of answers assigned to each participant
- This provides a snapshot of their overall effort, as well as capacity, and you can use the disparity between individuals and their various capacities to determine who might need more training
How to measure contributor bandwidth
Measuring participant workloads in Loopio’s RFP platform .
- Decide when to assign and start new RFPs
- Decide whether to decline new RFPs (if you wouldn’t have time to do an adequate job)
- Manage and address team burnout
- Decide whether you need more resources (when combined with revenue metrics)
- Calculate how much revenue additional capacity could bring in
"A key metric that should be captured is the number of answers completed per RFP by person or team. This provides an overall snapshot of effort. It tells me where I need to provide more training, and most importantly, I can see where we might be overloading one person or team."

Forecasting Costs Saved Through Software Efficiencies ($)
This is the amount of cost you anticipate saving, based on the number of minutes you are currently saving thanks to proposal automation.
This metric tells you how efficiently your team repurposes answers and saves time using RFP software. This is particularly useful for making a case for more proposal automation tools. If you use an industry benchmark for the average number of responses automated, you can get a fairly accurate estimate for how much time (or money) an RFP automation software might save.
- First, you’ll have to track the number of questions your tool answers for you
- Your content answer automation rate). Multiply that rate (30%, let’s say) by the average number of minutes spent on each question (12)
- Multiply that by the total number of questions (115). The result, 483 minutes saved per RFP, can then be multiplied by the per-minute employee pay rate to calculate savings
- Secure buy-in for using software to help you complete more RFPs
- Decide whether you should purchase a dedicated RFP response software to improve capacity
- Determine whether you’re getting a positive ROI on your proposal management software

Chapter 7. When to Use Each Proposal Metric
Now that you’re familiar with the 22 proposal metrics you can track, we’ll share exactly where you can begin using them throughout your RFP process, from beginning to end.
Begin by examining your current RFP process. What’s the first step you take? And what’s the second?
Make a list of steps that you normally take when answering an RFP. Then, line up the decisions you’d like to make (that could affect change) at each stage of your process. Finally, choose a metric you can measure that’ll inform decision-making for each step.
Below are some examples to get you started.
Once you’ve picked the areas you’d like to focus on, download this RFP analytics template.
Filter the template down to the RFP metric you’d like to focus on. Then, diligently record your findings over the course of three months. After three months have passed, analyze trends in the data and share recommendations with leadership.
Remember: start small. Choose metrics that your team has control over, which will make a tangible impact on your work-life.

Chapter 8. Setting Up Your Process for Ongoing Success
To set yourself up for long-term success, it’s important to take a step back, and understand your process from start to finish.
Diagram precisely what happens (or what should happen) when an RFP comes in. Whose responsibility is it at each stage? Without clear distinctions, new RFPs tend to create a spiral of confusion where everyone waits for someone else to take it on. Or, salespeople wait until the last minute to tell the proposal team about an RFP.
Create a Consistent Intake Process
You’ll also want to implement what’s known as a go/no-go process if you don’t already have one. This is a checklist you can use to score new opportunities and quickly decide whether or not to respond. It’s a data-driven way to dedicate your efforts to the opportunities most likely to win, in order to conserve resources and save time.
Here’s an example RFP intake process:
- Sales notify the proposal team that an RFP is expected (before it is released)
- The RFP team stages the information in Salesforce and gauges team capacity
- Once the RFP is announced, Sales sends it to the RFP team within three days
- The RFP team assesses it based on the Go/No-go process
- The RFP team accepts the proposal and builds out a project plan, working back from 24 hours before the due date
Build Your RFP Dream Team
RFPs are a team sport. So to succeed in the long-term, it’s important to clearly define everyone’s role and tell them precisely what is expected of them.
There are two groups of roles in any RFP program—contributors and reviewers. You’ll need buy-in from your contributors to track RFP metrics like capacity, satisfaction, and win rate, as they’ll have to time themselves and record those numbers.
You’ll need buy-in from your reviewers on which metrics you should track, as they’re the ones who’ll likely be making decisions with them.
For each point on your RFP analytics process document, note who is responsible for delivering information and when, and who is accountable for reviewing it.
This creates accountability and helps people track down missing information. Learning more about the ideal bid team structure can help with this too.
Set Up Your Tools
Ideally, you already have these systems in place. But if not, here are a few tools we recommend.
- A system for measuring the proposal process: Use a CRM like Salesforce, Microsoft Dynamics , or similar to track incoming deals that include RFPs. (Ensure you’re capturing account owner, revenue earned, important proposal dates, sales stages, timeline, customer, and the region as part of that.) For a low-budget option, you could get by with a shared spreadsheet, though updating it may cut into your response time.
- A system for capturing content management: Designate a centralized place to capture RFP content (the RFP answers, graphics, etc.) and record RFP metrics. This is how you can track metrics across RFPs, recycle the best answers, and see what’s working. In some cases, a dedicated response software can help with proposal automation, automatically inputting answers. Whether you choose an RFP software like Loopio or file storage like Google Drive, Sharepoint, or Dropbox, this is a must.
You may also want to publish a shared RFP analytics document that outlines:
- Which RFP metrics you’ll track
- Who the data owners are (and their contact info)
- How often data is to be reported
- Who is responsible for providing input
- How the RFP metrics are to be analyzed
- How exceptions are to be handled
- What will happen when certain thresholds (like capacity) are reached
Finally, ensure you have a complete reporting schema that all stakeholders agree to. What information do they want to see? How will the information be reported throughout the organization?
Metrics on my Mind
As you learned at the start of this guide, the true measure of a metric is whether it helps you make a decision. If you take away nothing else from this guide, remember:
- Dashboards and tracking don’t mean much without a process to support them
- More isn’t necessarily better—it’s what helps you achieve selections and wins
- Don’t forget to ask people how satisfied they are, and how they’d improve the process
And above all, remember that you can reach out to your RFP community for support on how to measure these metrics anytime.
Take Your Proposal Metrics to the Next Level
See how Loopio's RFP software can help today.
IMAGES
VIDEO
COMMENTS
Step 4 - Write your KPIs. Finally, it's time to begin actually writing your KPIs. KPIs should follow the SMART format (specific, measurable, attainable, relevant, and time-bound), to ensure your KPIs meet this criterion, we've devised a formula that you can follow to ensure you end up with SMART KPIs every time.
When writing the KPIs section in a proposal template, it's important to be specific and realistic. Start by identifying the main objectives of the project and then determine the metrics that will be used to measure the success of these objectives. Some common KPIs include: Financial Metrics: Revenue, ROI, Cost of Goods Sold.
Website KPI examples. 21. Traffic to MQL (Marketing Qualified Lead) Ratio: The ratio of the total traffic platform generated vs. the number of marketing qualified leads coming from that traffic. 22. Crawl Errors: The number of URLs that are inaccessible to Googlebot when it scans your pages. 23.
The final type of KPI is a change indicator. These are used to measure the quantifiable change in a metric or measure. An example would be, "X% increase in sales.". It adds a change measure to a quantifiable target and is usually measured as a percentage increase in a given period of time.
Steps in Developing Key Performance Indicators. Here are seven essential steps that lead you to develop robust KPIs that drive performance, inform decision-making, and contribute to the achievement of your organizational objectives. Step 1: Identify and Prioritize Strategic Goals.
Sales KPI Examples. Sales leaders and their teams need to track the key performance indicators that help them close more orders. Below are the 15 essential sales KPI examples: New Inbound Leads. Lead Response Time. Lead Conversion %. New Qualified Opportunities. Total Pipeline Value. Lead-to-Opportunity %.
Define KPI's values properly: baseline, target, current value. Don't mix the idea of target and goal ("improve customer service performance" is the goal and "… by 10%" is the target). Decide if you need to increase the value (increase profits) of the indicator or decrease it (decrease response time). 2. Normalize KPIs.
Click-Through-Rate (CTR) Marketers use this KPI to measure engagement across channels with their content. The formula for calculating click-through-rate is very simple: (Total clicks / Total Impressions) x 100 = CTR. For example: If your LinkedIn ad had 17 clicks and 2253 impressions, then your CTR would be 0,75%.
Key Performance Indicators (KPIs) gauge the success of a business, organization, or individual in reaching specific objectives. The KPIs can differ based on industry, company, and personal objectives. Popular KPI examples include customer satisfaction, employee retention, revenue growth, and cost reduction. KPIs are often measured on a periodic ...
Summary. KPIs, or key performance indicators, are metrics that measure the progress of a specific project toward your defined goals. KPIs need to be quantifiable and relevant, and should provide concrete evidence to make project decisions going forward. A key performance indicator (KPI) is a quantitative metric of how your team or organization ...
To calculate your proposal ROI, subtract the cost of proposal production from the profit of contract performance and divide by the cost of proposal production. You can also analyze your proposal ...
A KPI report is a performance tracking tool that allows you to quickly analyze key performance indicators and understand how your organization is doing with respect to specific goals. They include data visualization, consisting of charts, tables, and graphs. Modern KPI reports are interactive, and all the underlying data can be accessed quickly.
To help smooth the way, I've developed a sample KPI template that you can use when designing your own indicators. This is based on 20 years of practical experience helping companies develop relevant and meaningful business metrics and is the template I use with my clients. Download Blank Template. Download Completed Template.
3. Mathematically determine the five-year target for that KPI. Let's say your most important financial KPI is to double profits in five years. You'll need to then do the math and come up with that final number. As an oversimplified example, if you make $50 a year, your goal would be $100 in five years.
KPIs, on the other can, can be used to measure proposal success: 1. Win Rate: The win rate is a simple yet critical KPI that measures the percentage of proposals that result in a win. It's an effective way to gauge your proposal's overall success and the effectiveness of your qualification process and bid strategy. 2.
2. Turn your KPI presentation into a PDF report. PDFs are a great way to present KPI reports because they maintain a clean and organized format for web, email, and print. PDFs are arguably the best reporting tool for print because it presents your KPIs based on how they appear on your dashboard.. Users have the ability to adjust the layout, size, height, annotations, quality, and style for ...
Step 4: Define the Project Deliverables. Defining your project deliverables is a crucial step during the project proposal process. Stakeholders want to know just what it is you're going to be delivering to them at the end of the project. This could be a product, a program, an upgrade in technology or something similar.
Proposal conversion is a critical sales KPI. A good proposal conversion rate is an indication of healthy, growing business. Most companies are unable to track proposal conversion trend for a given period e.g. sent proposals vs won proposals every month; sent proposal value vs won proposal value every month, average value of own proposal for a specific duration, number of proposal views by ...
Step 3: Develop key performance questions. Developing essential KPQs (key performance questions) can help you determine how to meet a specific objective. Avoid close-ended (yes-or-no) questions and ask thought-provoking, open-ended questions to create meaningful KPIs. Here are some obvious examples of KPQs:
Key performance indicators that target an entire organization's goals are called high KPIs. These indicators measure the company's success as a whole. KPIs that target smaller projects, such as departmental strategies, are called low KPIs. Related: A Guide To Understanding Objectives and Key Results (OKRs)
1. Title Page: Include the title of your proposal, your name or organization's name, the date, and any other relevant information specified by the guidelines. 2. Executive Summary: Provide a concise overview of your proposal, highlighting the key points and objectives.
6. The People Behind RFPs. 7. Using Each Proposal Metric. 8. Setting Up Your Process. RFP Analytics Template. Like a trusted advisor, request for proposal (RFP) metrics exist to guide your decisions. They offer insight into what's working, what's not, and your top opportunities to improve.