- Privacy Policy
Home » Research Results Section – Writing Guide and Examples

Research Results Section – Writing Guide and Examples
Table of Contents

Research Results
Research results refer to the findings and conclusions derived from a systematic investigation or study conducted to answer a specific question or hypothesis. These results are typically presented in a written report or paper and can include various forms of data such as numerical data, qualitative data, statistics, charts, graphs, and visual aids.
Results Section in Research
The results section of the research paper presents the findings of the study. It is the part of the paper where the researcher reports the data collected during the study and analyzes it to draw conclusions.
In the results section, the researcher should describe the data that was collected, the statistical analysis performed, and the findings of the study. It is important to be objective and not interpret the data in this section. Instead, the researcher should report the data as accurately and objectively as possible.
Structure of Research Results Section
The structure of the research results section can vary depending on the type of research conducted, but in general, it should contain the following components:
- Introduction: The introduction should provide an overview of the study, its aims, and its research questions. It should also briefly explain the methodology used to conduct the study.
- Data presentation : This section presents the data collected during the study. It may include tables, graphs, or other visual aids to help readers better understand the data. The data presented should be organized in a logical and coherent way, with headings and subheadings used to help guide the reader.
- Data analysis: In this section, the data presented in the previous section are analyzed and interpreted. The statistical tests used to analyze the data should be clearly explained, and the results of the tests should be presented in a way that is easy to understand.
- Discussion of results : This section should provide an interpretation of the results of the study, including a discussion of any unexpected findings. The discussion should also address the study’s research questions and explain how the results contribute to the field of study.
- Limitations: This section should acknowledge any limitations of the study, such as sample size, data collection methods, or other factors that may have influenced the results.
- Conclusions: The conclusions should summarize the main findings of the study and provide a final interpretation of the results. The conclusions should also address the study’s research questions and explain how the results contribute to the field of study.
- Recommendations : This section may provide recommendations for future research based on the study’s findings. It may also suggest practical applications for the study’s results in real-world settings.
Outline of Research Results Section
The following is an outline of the key components typically included in the Results section:
I. Introduction
- A brief overview of the research objectives and hypotheses
- A statement of the research question
II. Descriptive statistics
- Summary statistics (e.g., mean, standard deviation) for each variable analyzed
- Frequencies and percentages for categorical variables
III. Inferential statistics
- Results of statistical analyses, including tests of hypotheses
- Tables or figures to display statistical results
IV. Effect sizes and confidence intervals
- Effect sizes (e.g., Cohen’s d, odds ratio) to quantify the strength of the relationship between variables
- Confidence intervals to estimate the range of plausible values for the effect size
V. Subgroup analyses
- Results of analyses that examined differences between subgroups (e.g., by gender, age, treatment group)
VI. Limitations and assumptions
- Discussion of any limitations of the study and potential sources of bias
- Assumptions made in the statistical analyses
VII. Conclusions
- A summary of the key findings and their implications
- A statement of whether the hypotheses were supported or not
- Suggestions for future research
Example of Research Results Section
An Example of a Research Results Section could be:
- This study sought to examine the relationship between sleep quality and academic performance in college students.
- Hypothesis : College students who report better sleep quality will have higher GPAs than those who report poor sleep quality.
- Methodology : Participants completed a survey about their sleep habits and academic performance.
II. Participants
- Participants were college students (N=200) from a mid-sized public university in the United States.
- The sample was evenly split by gender (50% female, 50% male) and predominantly white (85%).
- Participants were recruited through flyers and online advertisements.
III. Results
- Participants who reported better sleep quality had significantly higher GPAs (M=3.5, SD=0.5) than those who reported poor sleep quality (M=2.9, SD=0.6).
- See Table 1 for a summary of the results.
- Participants who reported consistent sleep schedules had higher GPAs than those with irregular sleep schedules.
IV. Discussion
- The results support the hypothesis that better sleep quality is associated with higher academic performance in college students.
- These findings have implications for college students, as prioritizing sleep could lead to better academic outcomes.
- Limitations of the study include self-reported data and the lack of control for other variables that could impact academic performance.
V. Conclusion
- College students who prioritize sleep may see a positive impact on their academic performance.
- These findings highlight the importance of sleep in academic success.
- Future research could explore interventions to improve sleep quality in college students.
Example of Research Results in Research Paper :
Our study aimed to compare the performance of three different machine learning algorithms (Random Forest, Support Vector Machine, and Neural Network) in predicting customer churn in a telecommunications company. We collected a dataset of 10,000 customer records, with 20 predictor variables and a binary churn outcome variable.
Our analysis revealed that all three algorithms performed well in predicting customer churn, with an overall accuracy of 85%. However, the Random Forest algorithm showed the highest accuracy (88%), followed by the Support Vector Machine (86%) and the Neural Network (84%).
Furthermore, we found that the most important predictor variables for customer churn were monthly charges, contract type, and tenure. Random Forest identified monthly charges as the most important variable, while Support Vector Machine and Neural Network identified contract type as the most important.
Overall, our results suggest that machine learning algorithms can be effective in predicting customer churn in a telecommunications company, and that Random Forest is the most accurate algorithm for this task.
Example 3 :
Title : The Impact of Social Media on Body Image and Self-Esteem
Abstract : This study aimed to investigate the relationship between social media use, body image, and self-esteem among young adults. A total of 200 participants were recruited from a university and completed self-report measures of social media use, body image satisfaction, and self-esteem.
Results: The results showed that social media use was significantly associated with body image dissatisfaction and lower self-esteem. Specifically, participants who reported spending more time on social media platforms had lower levels of body image satisfaction and self-esteem compared to those who reported less social media use. Moreover, the study found that comparing oneself to others on social media was a significant predictor of body image dissatisfaction and lower self-esteem.
Conclusion : These results suggest that social media use can have negative effects on body image satisfaction and self-esteem among young adults. It is important for individuals to be mindful of their social media use and to recognize the potential negative impact it can have on their mental health. Furthermore, interventions aimed at promoting positive body image and self-esteem should take into account the role of social media in shaping these attitudes and behaviors.
Importance of Research Results
Research results are important for several reasons, including:
- Advancing knowledge: Research results can contribute to the advancement of knowledge in a particular field, whether it be in science, technology, medicine, social sciences, or humanities.
- Developing theories: Research results can help to develop or modify existing theories and create new ones.
- Improving practices: Research results can inform and improve practices in various fields, such as education, healthcare, business, and public policy.
- Identifying problems and solutions: Research results can identify problems and provide solutions to complex issues in society, including issues related to health, environment, social justice, and economics.
- Validating claims : Research results can validate or refute claims made by individuals or groups in society, such as politicians, corporations, or activists.
- Providing evidence: Research results can provide evidence to support decision-making, policy-making, and resource allocation in various fields.
How to Write Results in A Research Paper
Here are some general guidelines on how to write results in a research paper:
- Organize the results section: Start by organizing the results section in a logical and coherent manner. Divide the section into subsections if necessary, based on the research questions or hypotheses.
- Present the findings: Present the findings in a clear and concise manner. Use tables, graphs, and figures to illustrate the data and make the presentation more engaging.
- Describe the data: Describe the data in detail, including the sample size, response rate, and any missing data. Provide relevant descriptive statistics such as means, standard deviations, and ranges.
- Interpret the findings: Interpret the findings in light of the research questions or hypotheses. Discuss the implications of the findings and the extent to which they support or contradict existing theories or previous research.
- Discuss the limitations : Discuss the limitations of the study, including any potential sources of bias or confounding factors that may have affected the results.
- Compare the results : Compare the results with those of previous studies or theoretical predictions. Discuss any similarities, differences, or inconsistencies.
- Avoid redundancy: Avoid repeating information that has already been presented in the introduction or methods sections. Instead, focus on presenting new and relevant information.
- Be objective: Be objective in presenting the results, avoiding any personal biases or interpretations.
When to Write Research Results
Here are situations When to Write Research Results”
- After conducting research on the chosen topic and obtaining relevant data, organize the findings in a structured format that accurately represents the information gathered.
- Once the data has been analyzed and interpreted, and conclusions have been drawn, begin the writing process.
- Before starting to write, ensure that the research results adhere to the guidelines and requirements of the intended audience, such as a scientific journal or academic conference.
- Begin by writing an abstract that briefly summarizes the research question, methodology, findings, and conclusions.
- Follow the abstract with an introduction that provides context for the research, explains its significance, and outlines the research question and objectives.
- The next section should be a literature review that provides an overview of existing research on the topic and highlights the gaps in knowledge that the current research seeks to address.
- The methodology section should provide a detailed explanation of the research design, including the sample size, data collection methods, and analytical techniques used.
- Present the research results in a clear and concise manner, using graphs, tables, and figures to illustrate the findings.
- Discuss the implications of the research results, including how they contribute to the existing body of knowledge on the topic and what further research is needed.
- Conclude the paper by summarizing the main findings, reiterating the significance of the research, and offering suggestions for future research.
Purpose of Research Results
The purposes of Research Results are as follows:
- Informing policy and practice: Research results can provide evidence-based information to inform policy decisions, such as in the fields of healthcare, education, and environmental regulation. They can also inform best practices in fields such as business, engineering, and social work.
- Addressing societal problems : Research results can be used to help address societal problems, such as reducing poverty, improving public health, and promoting social justice.
- Generating economic benefits : Research results can lead to the development of new products, services, and technologies that can create economic value and improve quality of life.
- Supporting academic and professional development : Research results can be used to support academic and professional development by providing opportunities for students, researchers, and practitioners to learn about new findings and methodologies in their field.
- Enhancing public understanding: Research results can help to educate the public about important issues and promote scientific literacy, leading to more informed decision-making and better public policy.
- Evaluating interventions: Research results can be used to evaluate the effectiveness of interventions, such as treatments, educational programs, and social policies. This can help to identify areas where improvements are needed and guide future interventions.
- Contributing to scientific progress: Research results can contribute to the advancement of science by providing new insights and discoveries that can lead to new theories, methods, and techniques.
- Informing decision-making : Research results can provide decision-makers with the information they need to make informed decisions. This can include decision-making at the individual, organizational, or governmental levels.
- Fostering collaboration : Research results can facilitate collaboration between researchers and practitioners, leading to new partnerships, interdisciplinary approaches, and innovative solutions to complex problems.
Advantages of Research Results
Some Advantages of Research Results are as follows:
- Improved decision-making: Research results can help inform decision-making in various fields, including medicine, business, and government. For example, research on the effectiveness of different treatments for a particular disease can help doctors make informed decisions about the best course of treatment for their patients.
- Innovation : Research results can lead to the development of new technologies, products, and services. For example, research on renewable energy sources can lead to the development of new and more efficient ways to harness renewable energy.
- Economic benefits: Research results can stimulate economic growth by providing new opportunities for businesses and entrepreneurs. For example, research on new materials or manufacturing techniques can lead to the development of new products and processes that can create new jobs and boost economic activity.
- Improved quality of life: Research results can contribute to improving the quality of life for individuals and society as a whole. For example, research on the causes of a particular disease can lead to the development of new treatments and cures, improving the health and well-being of millions of people.
About the author

Muhammad Hassan
Researcher, Academic Writer, Web developer
You may also like

Research Approach – Types Methods and Examples

Research Summary – Structure, Examples and...

Research Paper Conclusion – Writing Guide and...

Future Research – Thesis Guide

Research Problem – Examples, Types and Guide

Research Process – Steps, Examples and Tips
Generate accurate APA citations for free
- Knowledge Base
- APA Style 7th edition
- How to write an APA results section
Reporting Research Results in APA Style | Tips & Examples
Published on December 21, 2020 by Pritha Bhandari . Revised on January 17, 2024.
The results section of a quantitative research paper is where you summarize your data and report the findings of any relevant statistical analyses.
The APA manual provides rigorous guidelines for what to report in quantitative research papers in the fields of psychology, education, and other social sciences.
Use these standards to answer your research questions and report your data analyses in a complete and transparent way.
Instantly correct all language mistakes in your text
Upload your document to correct all your mistakes in minutes

Table of contents
What goes in your results section, introduce your data, summarize your data, report statistical results, presenting numbers effectively, what doesn’t belong in your results section, frequently asked questions about results in apa.
In APA style, the results section includes preliminary information about the participants and data, descriptive and inferential statistics, and the results of any exploratory analyses.
Include these in your results section:
- Participant flow and recruitment period. Report the number of participants at every stage of the study, as well as the dates when recruitment took place.
- Missing data . Identify the proportion of data that wasn’t included in your final analysis and state the reasons.
- Any adverse events. Make sure to report any unexpected events or side effects (for clinical studies).
- Descriptive statistics . Summarize the primary and secondary outcomes of the study.
- Inferential statistics , including confidence intervals and effect sizes. Address the primary and secondary research questions by reporting the detailed results of your main analyses.
- Results of subgroup or exploratory analyses, if applicable. Place detailed results in supplementary materials.
Write up the results in the past tense because you’re describing the outcomes of a completed research study.
Are your APA in-text citations flawless?
The AI-powered APA Citation Checker points out every error, tells you exactly what’s wrong, and explains how to fix it. Say goodbye to losing marks on your assignment!
Get started!

Before diving into your research findings, first describe the flow of participants at every stage of your study and whether any data were excluded from the final analysis.
Participant flow and recruitment period
It’s necessary to report any attrition, which is the decline in participants at every sequential stage of a study. That’s because an uneven number of participants across groups sometimes threatens internal validity and makes it difficult to compare groups. Be sure to also state all reasons for attrition.
If your study has multiple stages (e.g., pre-test, intervention, and post-test) and groups (e.g., experimental and control groups), a flow chart is the best way to report the number of participants in each group per stage and reasons for attrition.
Also report the dates for when you recruited participants or performed follow-up sessions.
Missing data
Another key issue is the completeness of your dataset. It’s necessary to report both the amount and reasons for data that was missing or excluded.
Data can become unusable due to equipment malfunctions, improper storage, unexpected events, participant ineligibility, and so on. For each case, state the reason why the data were unusable.
Some data points may be removed from the final analysis because they are outliers—but you must be able to justify how you decided what to exclude.
If you applied any techniques for overcoming or compensating for lost data, report those as well.
Adverse events
For clinical studies, report all events with serious consequences or any side effects that occured.
Descriptive statistics summarize your data for the reader. Present descriptive statistics for each primary, secondary, and subgroup analysis.
Don’t provide formulas or citations for commonly used statistics (e.g., standard deviation) – but do provide them for new or rare equations.
Descriptive statistics
The exact descriptive statistics that you report depends on the types of data in your study. Categorical variables can be reported using proportions, while quantitative data can be reported using means and standard deviations . For a large set of numbers, a table is the most effective presentation format.
Include sample sizes (overall and for each group) as well as appropriate measures of central tendency and variability for the outcomes in your results section. For every point estimate , add a clearly labelled measure of variability as well.
Be sure to note how you combined data to come up with variables of interest. For every variable of interest, explain how you operationalized it.
According to APA journal standards, it’s necessary to report all relevant hypothesis tests performed, estimates of effect sizes, and confidence intervals.
When reporting statistical results, you should first address primary research questions before moving onto secondary research questions and any exploratory or subgroup analyses.
Present the results of tests in the order that you performed them—report the outcomes of main tests before post-hoc tests, for example. Don’t leave out any relevant results, even if they don’t support your hypothesis.
Inferential statistics
For each statistical test performed, first restate the hypothesis , then state whether your hypothesis was supported and provide the outcomes that led you to that conclusion.
Report the following for each hypothesis test:
- the test statistic value,
- the degrees of freedom ,
- the exact p- value (unless it is less than 0.001),
- the magnitude and direction of the effect.
When reporting complex data analyses, such as factor analysis or multivariate analysis, present the models estimated in detail, and state the statistical software used. Make sure to report any violations of statistical assumptions or problems with estimation.
Effect sizes and confidence intervals
For each hypothesis test performed, you should present confidence intervals and estimates of effect sizes .
Confidence intervals are useful for showing the variability around point estimates. They should be included whenever you report population parameter estimates.
Effect sizes indicate how impactful the outcomes of a study are. But since they are estimates, it’s recommended that you also provide confidence intervals of effect sizes.
Subgroup or exploratory analyses
Briefly report the results of any other planned or exploratory analyses you performed. These may include subgroup analyses as well.
Subgroup analyses come with a high chance of false positive results, because performing a large number of comparison or correlation tests increases the chances of finding significant results.
If you find significant results in these analyses, make sure to appropriately report them as exploratory (rather than confirmatory) results to avoid overstating their importance.
While these analyses can be reported in less detail in the main text, you can provide the full analyses in supplementary materials.
Prevent plagiarism. Run a free check.
To effectively present numbers, use a mix of text, tables , and figures where appropriate:
- To present three or fewer numbers, try a sentence ,
- To present between 4 and 20 numbers, try a table ,
- To present more than 20 numbers, try a figure .
Since these are general guidelines, use your own judgment and feedback from others for effective presentation of numbers.
Tables and figures should be numbered and have titles, along with relevant notes. Make sure to present data only once throughout the paper and refer to any tables and figures in the text.
Formatting statistics and numbers
It’s important to follow capitalization , italicization, and abbreviation rules when referring to statistics in your paper. There are specific format guidelines for reporting statistics in APA , as well as general rules about writing numbers .
If you are unsure of how to present specific symbols, look up the detailed APA guidelines or other papers in your field.
It’s important to provide a complete picture of your data analyses and outcomes in a concise way. For that reason, raw data and any interpretations of your results are not included in the results section.
It’s rarely appropriate to include raw data in your results section. Instead, you should always save the raw data securely and make them available and accessible to any other researchers who request them.
Making scientific research available to others is a key part of academic integrity and open science.
Interpretation or discussion of results
This belongs in your discussion section. Your results section is where you objectively report all relevant findings and leave them open for interpretation by readers.
While you should state whether the findings of statistical tests lend support to your hypotheses, refrain from forming conclusions to your research questions in the results section.
Explanation of how statistics tests work
For the sake of concise writing, you can safely assume that readers of your paper have professional knowledge of how statistical inferences work.
In an APA results section , you should generally report the following:
- Participant flow and recruitment period.
- Missing data and any adverse events.
- Descriptive statistics about your samples.
- Inferential statistics , including confidence intervals and effect sizes.
- Results of any subgroup or exploratory analyses, if applicable.
According to the APA guidelines, you should report enough detail on inferential statistics so that your readers understand your analyses.
- the test statistic value
- the degrees of freedom
- the exact p value (unless it is less than 0.001)
- the magnitude and direction of the effect
You should also present confidence intervals and estimates of effect sizes where relevant.
In APA style, statistics can be presented in the main text or as tables or figures . To decide how to present numbers, you can follow APA guidelines:
- To present three or fewer numbers, try a sentence,
- To present between 4 and 20 numbers, try a table,
- To present more than 20 numbers, try a figure.
Results are usually written in the past tense , because they are describing the outcome of completed actions.
The results chapter or section simply and objectively reports what you found, without speculating on why you found these results. The discussion interprets the meaning of the results, puts them in context, and explains why they matter.
In qualitative research , results and discussion are sometimes combined. But in quantitative research , it’s considered important to separate the objective results from your interpretation of them.
Cite this Scribbr article
If you want to cite this source, you can copy and paste the citation or click the “Cite this Scribbr article” button to automatically add the citation to our free Citation Generator.
Bhandari, P. (2024, January 17). Reporting Research Results in APA Style | Tips & Examples. Scribbr. Retrieved June 24, 2024, from https://www.scribbr.com/apa-style/results-section/
Is this article helpful?

Pritha Bhandari
Other students also liked, how to write an apa methods section, how to format tables and figures in apa style, reporting statistics in apa style | guidelines & examples, "i thought ai proofreading was useless but..".
I've been using Scribbr for years now and I know it's a service that won't disappoint. It does a good job spotting mistakes”
- Affiliate Program

- UNITED STATES
- 台灣 (TAIWAN)
- TÜRKIYE (TURKEY)
- Academic Editing Services
- - Research Paper
- - Journal Manuscript
- - Dissertation
- - College & University Assignments
- Admissions Editing Services
- - Application Essay
- - Personal Statement
- - Recommendation Letter
- - Cover Letter
- - CV/Resume
- Business Editing Services
- - Business Documents
- - Report & Brochure
- - Website & Blog
- Writer Editing Services
- - Script & Screenplay
- Our Editors
- Client Reviews
- Editing & Proofreading Prices
- Wordvice Points
- Partner Discount
- Plagiarism Checker
- APA Citation Generator
- MLA Citation Generator
- Chicago Citation Generator
- Vancouver Citation Generator
- - APA Style
- - MLA Style
- - Chicago Style
- - Vancouver Style
- Writing & Editing Guide
- Academic Resources
- Admissions Resources
How to Write the Results/Findings Section in Research
What is the research paper Results section and what does it do?
The Results section of a scientific research paper represents the core findings of a study derived from the methods applied to gather and analyze information. It presents these findings in a logical sequence without bias or interpretation from the author, setting up the reader for later interpretation and evaluation in the Discussion section. A major purpose of the Results section is to break down the data into sentences that show its significance to the research question(s).
The Results section appears third in the section sequence in most scientific papers. It follows the presentation of the Methods and Materials and is presented before the Discussion section —although the Results and Discussion are presented together in many journals. This section answers the basic question “What did you find in your research?”
What is included in the Results section?
The Results section should include the findings of your study and ONLY the findings of your study. The findings include:
- Data presented in tables, charts, graphs, and other figures (may be placed into the text or on separate pages at the end of the manuscript)
- A contextual analysis of this data explaining its meaning in sentence form
- All data that corresponds to the central research question(s)
- All secondary findings (secondary outcomes, subgroup analyses, etc.)
If the scope of the study is broad, or if you studied a variety of variables, or if the methodology used yields a wide range of different results, the author should present only those results that are most relevant to the research question stated in the Introduction section .
As a general rule, any information that does not present the direct findings or outcome of the study should be left out of this section. Unless the journal requests that authors combine the Results and Discussion sections, explanations and interpretations should be omitted from the Results.
How are the results organized?
The best way to organize your Results section is “logically.” One logical and clear method of organizing research results is to provide them alongside the research questions—within each research question, present the type of data that addresses that research question.
Let’s look at an example. Your research question is based on a survey among patients who were treated at a hospital and received postoperative care. Let’s say your first research question is:

“What do hospital patients over age 55 think about postoperative care?”
This can actually be represented as a heading within your Results section, though it might be presented as a statement rather than a question:
Attitudes towards postoperative care in patients over the age of 55
Now present the results that address this specific research question first. In this case, perhaps a table illustrating data from a survey. Likert items can be included in this example. Tables can also present standard deviations, probabilities, correlation matrices, etc.
Following this, present a content analysis, in words, of one end of the spectrum of the survey or data table. In our example case, start with the POSITIVE survey responses regarding postoperative care, using descriptive phrases. For example:
“Sixty-five percent of patients over 55 responded positively to the question “ Are you satisfied with your hospital’s postoperative care ?” (Fig. 2)
Include other results such as subcategory analyses. The amount of textual description used will depend on how much interpretation of tables and figures is necessary and how many examples the reader needs in order to understand the significance of your research findings.
Next, present a content analysis of another part of the spectrum of the same research question, perhaps the NEGATIVE or NEUTRAL responses to the survey. For instance:
“As Figure 1 shows, 15 out of 60 patients in Group A responded negatively to Question 2.”
After you have assessed the data in one figure and explained it sufficiently, move on to your next research question. For example:
“How does patient satisfaction correspond to in-hospital improvements made to postoperative care?”

This kind of data may be presented through a figure or set of figures (for instance, a paired T-test table).
Explain the data you present, here in a table, with a concise content analysis:
“The p-value for the comparison between the before and after groups of patients was .03% (Fig. 2), indicating that the greater the dissatisfaction among patients, the more frequent the improvements that were made to postoperative care.”
Let’s examine another example of a Results section from a study on plant tolerance to heavy metal stress . In the Introduction section, the aims of the study are presented as “determining the physiological and morphological responses of Allium cepa L. towards increased cadmium toxicity” and “evaluating its potential to accumulate the metal and its associated environmental consequences.” The Results section presents data showing how these aims are achieved in tables alongside a content analysis, beginning with an overview of the findings:
“Cadmium caused inhibition of root and leave elongation, with increasing effects at higher exposure doses (Fig. 1a-c).”
The figure containing this data is cited in parentheses. Note that this author has combined three graphs into one single figure. Separating the data into separate graphs focusing on specific aspects makes it easier for the reader to assess the findings, and consolidating this information into one figure saves space and makes it easy to locate the most relevant results.

Following this overall summary, the relevant data in the tables is broken down into greater detail in text form in the Results section.
- “Results on the bio-accumulation of cadmium were found to be the highest (17.5 mg kgG1) in the bulb, when the concentration of cadmium in the solution was 1×10G2 M and lowest (0.11 mg kgG1) in the leaves when the concentration was 1×10G3 M.”
Captioning and Referencing Tables and Figures
Tables and figures are central components of your Results section and you need to carefully think about the most effective way to use graphs and tables to present your findings . Therefore, it is crucial to know how to write strong figure captions and to refer to them within the text of the Results section.
The most important advice one can give here as well as throughout the paper is to check the requirements and standards of the journal to which you are submitting your work. Every journal has its own design and layout standards, which you can find in the author instructions on the target journal’s website. Perusing a journal’s published articles will also give you an idea of the proper number, size, and complexity of your figures.
Regardless of which format you use, the figures should be placed in the order they are referenced in the Results section and be as clear and easy to understand as possible. If there are multiple variables being considered (within one or more research questions), it can be a good idea to split these up into separate figures. Subsequently, these can be referenced and analyzed under separate headings and paragraphs in the text.
To create a caption, consider the research question being asked and change it into a phrase. For instance, if one question is “Which color did participants choose?”, the caption might be “Color choice by participant group.” Or in our last research paper example, where the question was “What is the concentration of cadmium in different parts of the onion after 14 days?” the caption reads:
“Fig. 1(a-c): Mean concentration of Cd determined in (a) bulbs, (b) leaves, and (c) roots of onions after a 14-day period.”
Steps for Composing the Results Section
Because each study is unique, there is no one-size-fits-all approach when it comes to designing a strategy for structuring and writing the section of a research paper where findings are presented. The content and layout of this section will be determined by the specific area of research, the design of the study and its particular methodologies, and the guidelines of the target journal and its editors. However, the following steps can be used to compose the results of most scientific research studies and are essential for researchers who are new to preparing a manuscript for publication or who need a reminder of how to construct the Results section.
Step 1 : Consult the guidelines or instructions that the target journal or publisher provides authors and read research papers it has published, especially those with similar topics, methods, or results to your study.
- The guidelines will generally outline specific requirements for the results or findings section, and the published articles will provide sound examples of successful approaches.
- Note length limitations on restrictions on content. For instance, while many journals require the Results and Discussion sections to be separate, others do not—qualitative research papers often include results and interpretations in the same section (“Results and Discussion”).
- Reading the aims and scope in the journal’s “ guide for authors ” section and understanding the interests of its readers will be invaluable in preparing to write the Results section.
Step 2 : Consider your research results in relation to the journal’s requirements and catalogue your results.
- Focus on experimental results and other findings that are especially relevant to your research questions and objectives and include them even if they are unexpected or do not support your ideas and hypotheses.
- Catalogue your findings—use subheadings to streamline and clarify your report. This will help you avoid excessive and peripheral details as you write and also help your reader understand and remember your findings. Create appendices that might interest specialists but prove too long or distracting for other readers.
- Decide how you will structure of your results. You might match the order of the research questions and hypotheses to your results, or you could arrange them according to the order presented in the Methods section. A chronological order or even a hierarchy of importance or meaningful grouping of main themes or categories might prove effective. Consider your audience, evidence, and most importantly, the objectives of your research when choosing a structure for presenting your findings.
Step 3 : Design figures and tables to present and illustrate your data.
- Tables and figures should be numbered according to the order in which they are mentioned in the main text of the paper.
- Information in figures should be relatively self-explanatory (with the aid of captions), and their design should include all definitions and other information necessary for readers to understand the findings without reading all of the text.
- Use tables and figures as a focal point to tell a clear and informative story about your research and avoid repeating information. But remember that while figures clarify and enhance the text, they cannot replace it.
Step 4 : Draft your Results section using the findings and figures you have organized.
- The goal is to communicate this complex information as clearly and precisely as possible; precise and compact phrases and sentences are most effective.
- In the opening paragraph of this section, restate your research questions or aims to focus the reader’s attention to what the results are trying to show. It is also a good idea to summarize key findings at the end of this section to create a logical transition to the interpretation and discussion that follows.
- Try to write in the past tense and the active voice to relay the findings since the research has already been done and the agent is usually clear. This will ensure that your explanations are also clear and logical.
- Make sure that any specialized terminology or abbreviation you have used here has been defined and clarified in the Introduction section .
Step 5 : Review your draft; edit and revise until it reports results exactly as you would like to have them reported to your readers.
- Double-check the accuracy and consistency of all the data, as well as all of the visual elements included.
- Read your draft aloud to catch language errors (grammar, spelling, and mechanics), awkward phrases, and missing transitions.
- Ensure that your results are presented in the best order to focus on objectives and prepare readers for interpretations, valuations, and recommendations in the Discussion section . Look back over the paper’s Introduction and background while anticipating the Discussion and Conclusion sections to ensure that the presentation of your results is consistent and effective.
- Consider seeking additional guidance on your paper. Find additional readers to look over your Results section and see if it can be improved in any way. Peers, professors, or qualified experts can provide valuable insights.
One excellent option is to use a professional English proofreading and editing service such as Wordvice, including our paper editing service . With hundreds of qualified editors from dozens of scientific fields, Wordvice has helped thousands of authors revise their manuscripts and get accepted into their target journals. Read more about the proofreading and editing process before proceeding with getting academic editing services and manuscript editing services for your manuscript.
As the representation of your study’s data output, the Results section presents the core information in your research paper. By writing with clarity and conciseness and by highlighting and explaining the crucial findings of their study, authors increase the impact and effectiveness of their research manuscripts.
For more articles and videos on writing your research manuscript, visit Wordvice’s Resources page.
Wordvice Resources
- How to Write a Research Paper Introduction
- Which Verb Tenses to Use in a Research Paper
- How to Write an Abstract for a Research Paper
- How to Write a Research Paper Title
- Useful Phrases for Academic Writing
- Common Transition Terms in Academic Papers
- Active and Passive Voice in Research Papers
- 100+ Verbs That Will Make Your Research Writing Amazing
- Tips for Paraphrasing in Research Papers
- USC Libraries
- Research Guides
Organizing Your Social Sciences Research Paper
- 7. The Results
- Purpose of Guide
- Design Flaws to Avoid
- Independent and Dependent Variables
- Glossary of Research Terms
- Reading Research Effectively
- Narrowing a Topic Idea
- Broadening a Topic Idea
- Extending the Timeliness of a Topic Idea
- Academic Writing Style
- Applying Critical Thinking
- Choosing a Title
- Making an Outline
- Paragraph Development
- Research Process Video Series
- Executive Summary
- The C.A.R.S. Model
- Background Information
- The Research Problem/Question
- Theoretical Framework
- Citation Tracking
- Content Alert Services
- Evaluating Sources
- Primary Sources
- Secondary Sources
- Tiertiary Sources
- Scholarly vs. Popular Publications
- Qualitative Methods
- Quantitative Methods
- Insiderness
- Using Non-Textual Elements
- Limitations of the Study
- Common Grammar Mistakes
- Writing Concisely
- Avoiding Plagiarism
- Footnotes or Endnotes?
- Further Readings
- Generative AI and Writing
- USC Libraries Tutorials and Other Guides
- Bibliography
The results section is where you report the findings of your study based upon the methodology [or methodologies] you applied to gather information. The results section should state the findings of the research arranged in a logical sequence without bias or interpretation. A section describing results should be particularly detailed if your paper includes data generated from your own research.
Annesley, Thomas M. "Show Your Cards: The Results Section and the Poker Game." Clinical Chemistry 56 (July 2010): 1066-1070.
Importance of a Good Results Section
When formulating the results section, it's important to remember that the results of a study do not prove anything . Findings can only confirm or reject the hypothesis underpinning your study. However, the act of articulating the results helps you to understand the problem from within, to break it into pieces, and to view the research problem from various perspectives.
The page length of this section is set by the amount and types of data to be reported . Be concise. Use non-textual elements appropriately, such as figures and tables, to present findings more effectively. In deciding what data to describe in your results section, you must clearly distinguish information that would normally be included in a research paper from any raw data or other content that could be included as an appendix. In general, raw data that has not been summarized should not be included in the main text of your paper unless requested to do so by your professor.
Avoid providing data that is not critical to answering the research question . The background information you described in the introduction section should provide the reader with any additional context or explanation needed to understand the results. A good strategy is to always re-read the background section of your paper after you have written up your results to ensure that the reader has enough context to understand the results [and, later, how you interpreted the results in the discussion section of your paper that follows].
Bavdekar, Sandeep B. and Sneha Chandak. "Results: Unraveling the Findings." Journal of the Association of Physicians of India 63 (September 2015): 44-46; Brett, Paul. "A Genre Analysis of the Results Section of Sociology Articles." English for Specific Speakers 13 (1994): 47-59; Go to English for Specific Purposes on ScienceDirect;Burton, Neil et al. Doing Your Education Research Project . Los Angeles, CA: SAGE, 2008; Results. The Structure, Format, Content, and Style of a Journal-Style Scientific Paper. Department of Biology. Bates College; Kretchmer, Paul. Twelve Steps to Writing an Effective Results Section. San Francisco Edit; "Reporting Findings." In Making Sense of Social Research Malcolm Williams, editor. (London;: SAGE Publications, 2003) pp. 188-207.
Structure and Writing Style
I. Organization and Approach
For most research papers in the social and behavioral sciences, there are two possible ways of organizing the results . Both approaches are appropriate in how you report your findings, but use only one approach.
- Present a synopsis of the results followed by an explanation of key findings . This approach can be used to highlight important findings. For example, you may have noticed an unusual correlation between two variables during the analysis of your findings. It is appropriate to highlight this finding in the results section. However, speculating as to why this correlation exists and offering a hypothesis about what may be happening belongs in the discussion section of your paper.
- Present a result and then explain it, before presenting the next result then explaining it, and so on, then end with an overall synopsis . This is the preferred approach if you have multiple results of equal significance. It is more common in longer papers because it helps the reader to better understand each finding. In this model, it is helpful to provide a brief conclusion that ties each of the findings together and provides a narrative bridge to the discussion section of the your paper.
NOTE: Just as the literature review should be arranged under conceptual categories rather than systematically describing each source, you should also organize your findings under key themes related to addressing the research problem. This can be done under either format noted above [i.e., a thorough explanation of the key results or a sequential, thematic description and explanation of each finding].
II. Content
In general, the content of your results section should include the following:
- Introductory context for understanding the results by restating the research problem underpinning your study . This is useful in re-orientating the reader's focus back to the research problem after having read a review of the literature and your explanation of the methods used for gathering and analyzing information.
- Inclusion of non-textual elements, such as, figures, charts, photos, maps, tables, etc. to further illustrate key findings, if appropriate . Rather than relying entirely on descriptive text, consider how your findings can be presented visually. This is a helpful way of condensing a lot of data into one place that can then be referred to in the text. Consider referring to appendices if there is a lot of non-textual elements.
- A systematic description of your results, highlighting for the reader observations that are most relevant to the topic under investigation . Not all results that emerge from the methodology used to gather information may be related to answering the " So What? " question. Do not confuse observations with interpretations; observations in this context refers to highlighting important findings you discovered through a process of reviewing prior literature and gathering data.
- The page length of your results section is guided by the amount and types of data to be reported . However, focus on findings that are important and related to addressing the research problem. It is not uncommon to have unanticipated results that are not relevant to answering the research question. This is not to say that you don't acknowledge tangential findings and, in fact, can be referred to as areas for further research in the conclusion of your paper. However, spending time in the results section describing tangential findings clutters your overall results section and distracts the reader.
- A short paragraph that concludes the results section by synthesizing the key findings of the study . Highlight the most important findings you want readers to remember as they transition into the discussion section. This is particularly important if, for example, there are many results to report, the findings are complicated or unanticipated, or they are impactful or actionable in some way [i.e., able to be pursued in a feasible way applied to practice].
NOTE: Always use the past tense when referring to your study's findings. Reference to findings should always be described as having already happened because the method used to gather the information has been completed.
III. Problems to Avoid
When writing the results section, avoid doing the following :
- Discussing or interpreting your results . Save this for the discussion section of your paper, although where appropriate, you should compare or contrast specific results to those found in other studies [e.g., "Similar to the work of Smith [1990], one of the findings of this study is the strong correlation between motivation and academic achievement...."].
- Reporting background information or attempting to explain your findings. This should have been done in your introduction section, but don't panic! Often the results of a study point to the need for additional background information or to explain the topic further, so don't think you did something wrong. Writing up research is rarely a linear process. Always revise your introduction as needed.
- Ignoring negative results . A negative result generally refers to a finding that does not support the underlying assumptions of your study. Do not ignore them. Document these findings and then state in your discussion section why you believe a negative result emerged from your study. Note that negative results, and how you handle them, can give you an opportunity to write a more engaging discussion section, therefore, don't be hesitant to highlight them.
- Including raw data or intermediate calculations . Ask your professor if you need to include any raw data generated by your study, such as transcripts from interviews or data files. If raw data is to be included, place it in an appendix or set of appendices that are referred to in the text.
- Be as factual and concise as possible in reporting your findings . Do not use phrases that are vague or non-specific, such as, "appeared to be greater than other variables..." or "demonstrates promising trends that...." Subjective modifiers should be explained in the discussion section of the paper [i.e., why did one variable appear greater? Or, how does the finding demonstrate a promising trend?].
- Presenting the same data or repeating the same information more than once . If you want to highlight a particular finding, it is appropriate to do so in the results section. However, you should emphasize its significance in relation to addressing the research problem in the discussion section. Do not repeat it in your results section because you can do that in the conclusion of your paper.
- Confusing figures with tables . Be sure to properly label any non-textual elements in your paper. Don't call a chart an illustration or a figure a table. If you are not sure, go here .
Annesley, Thomas M. "Show Your Cards: The Results Section and the Poker Game." Clinical Chemistry 56 (July 2010): 1066-1070; Bavdekar, Sandeep B. and Sneha Chandak. "Results: Unraveling the Findings." Journal of the Association of Physicians of India 63 (September 2015): 44-46; Burton, Neil et al. Doing Your Education Research Project . Los Angeles, CA: SAGE, 2008; Caprette, David R. Writing Research Papers. Experimental Biosciences Resources. Rice University; Hancock, Dawson R. and Bob Algozzine. Doing Case Study Research: A Practical Guide for Beginning Researchers . 2nd ed. New York: Teachers College Press, 2011; Introduction to Nursing Research: Reporting Research Findings. Nursing Research: Open Access Nursing Research and Review Articles. (January 4, 2012); Kretchmer, Paul. Twelve Steps to Writing an Effective Results Section. San Francisco Edit ; Ng, K. H. and W. C. Peh. "Writing the Results." Singapore Medical Journal 49 (2008): 967-968; Reporting Research Findings. Wilder Research, in partnership with the Minnesota Department of Human Services. (February 2009); Results. The Structure, Format, Content, and Style of a Journal-Style Scientific Paper. Department of Biology. Bates College; Schafer, Mickey S. Writing the Results. Thesis Writing in the Sciences. Course Syllabus. University of Florida.
Writing Tip
Why Don't I Just Combine the Results Section with the Discussion Section?
It's not unusual to find articles in scholarly social science journals where the author(s) have combined a description of the findings with a discussion about their significance and implications. You could do this. However, if you are inexperienced writing research papers, consider creating two distinct sections for each section in your paper as a way to better organize your thoughts and, by extension, your paper. Think of the results section as the place where you report what your study found; think of the discussion section as the place where you interpret the information and answer the "So What?" question. As you become more skilled writing research papers, you can consider melding the results of your study with a discussion of its implications.
Driscoll, Dana Lynn and Aleksandra Kasztalska. Writing the Experimental Report: Methods, Results, and Discussion. The Writing Lab and The OWL. Purdue University.
- << Previous: Insiderness
- Next: Using Non-Textual Elements >>
- Last Updated: Jun 18, 2024 10:45 AM
- URL: https://libguides.usc.edu/writingguide
- Research Process
- Manuscript Preparation
- Manuscript Review
- Publication Process
- Publication Recognition
- Language Editing Services
- Translation Services

How to write the results section of a research paper
- 3 minute read
- 70.8K views
Table of Contents
At its core, a research paper aims to fill a gap in the research on a given topic. As a result, the results section of the paper, which describes the key findings of the study, is often considered the core of the paper. This is the section that gets the most attention from reviewers, peers, students, and any news organization reporting on your findings. Writing a clear, concise, and logical results section is, therefore, one of the most important parts of preparing your manuscript.
Difference between results and discussion
Before delving into how to write the results section, it is important to first understand the difference between the results and discussion sections. The results section needs to detail the findings of the study. The aim of this section is not to draw connections between the different findings or to compare it to previous findings in literature—that is the purview of the discussion section. Unlike the discussion section, which can touch upon the hypothetical, the results section needs to focus on the purely factual. In some cases, it may even be preferable to club these two sections together into a single section. For example, while writing a review article, it can be worthwhile to club these two sections together, as the main results in this case are the conclusions that can be drawn from the literature.
Structure of the results section
Although the main purpose of the results section in a research paper is to report the findings, it is necessary to present an introduction and repeat the research question. This establishes a connection to the previous section of the paper and creates a smooth flow of information.
Next, the results section needs to communicate the findings of your research in a systematic manner. The section needs to be organized such that the primary research question is addressed first, then the secondary research questions. If the research addresses multiple questions, the results section must individually connect with each of the questions. This ensures clarity and minimizes confusion while reading.
Consider representing your results visually. For example, graphs, tables, and other figures can help illustrate the findings of your paper, especially if there is a large amount of data in the results.
Remember, an appealing results section can help peer reviewers better understand the merits of your research, thereby increasing your chances of publication.
Practical guidance for writing an effective results section for a research paper
- Always use simple and clear language. Avoid the use of uncertain or out-of-focus expressions.
- The findings of the study must be expressed in an objective and unbiased manner. While it is acceptable to correlate certain findings in the discussion section, it is best to avoid overinterpreting the results.
- If the research addresses more than one hypothesis, use sub-sections to describe the results. This prevents confusion and promotes understanding.
- Ensure that negative results are included in this section, even if they do not support the research hypothesis.
- Wherever possible, use illustrations like tables, figures, charts, or other visual representations to showcase the results of your research paper. Mention these illustrations in the text, but do not repeat the information that they convey.
- For statistical data, it is adequate to highlight the tests and explain their results. The initial or raw data should not be mentioned in the results section of a research paper.
The results section of a research paper is usually the most impactful section because it draws the greatest attention. Regardless of the subject of your research paper, a well-written results section is capable of generating interest in your research.
For detailed information and assistance on writing the results of a research paper, refer to Elsevier Author Services.

Writing a good review article

Why is data validation important in research?
You may also like.

Page-Turner Articles are More Than Just Good Arguments: Be Mindful of Tone and Structure!

A Must-see for Researchers! How to Ensure Inclusivity in Your Scientific Writing

Make Hook, Line, and Sinker: The Art of Crafting Engaging Introductions

Can Describing Study Limitations Improve the Quality of Your Paper?

A Guide to Crafting Shorter, Impactful Sentences in Academic Writing

6 Steps to Write an Excellent Discussion in Your Manuscript

How to Write Clear and Crisp Civil Engineering Papers? Here are 5 Key Tips to Consider

The Clear Path to An Impactful Paper: ②
Input your search keywords and press Enter.
- Bipolar Disorder
- Therapy Center
- When To See a Therapist
- Types of Therapy
- Best Online Therapy
- Best Couples Therapy
- Best Family Therapy
- Managing Stress
- Sleep and Dreaming
- Understanding Emotions
- Self-Improvement
- Healthy Relationships
- Student Resources
- Personality Types
- Guided Meditations
- Verywell Mind Insights
- 2024 Verywell Mind 25
- Mental Health in the Classroom
- Editorial Process
- Meet Our Review Board
- Crisis Support
How to Write an APA Results Section
Kendra Cherry, MS, is a psychosocial rehabilitation specialist, psychology educator, and author of the "Everything Psychology Book."
:max_bytes(150000):strip_icc():format(webp)/IMG_9791-89504ab694d54b66bbd72cb84ffb860e.jpg "writing research paper results")
Emily is a board-certified science editor who has worked with top digital publishing brands like Voices for Biodiversity, Study.com, GoodTherapy, Vox, and Verywell.
:max_bytes(150000):strip_icc():format(webp)/Emily-Swaim-1000-0f3197de18f74329aeffb690a177160c.jpg "writing research paper results")
Verywell / Nusha Ashjaee
What to Include in an APA Results Section
- Justify Claims
- Summarize Results
Report All Relevant Results
- Report Statistical Findings
Include Tables and Figures
What not to include in an apa results section.
Psychology papers generally follow a specific structure. One important section of a paper is known as the results section. An APA results section of a psychology paper summarizes the data that was collected and the statistical analyses that were performed. The goal of this section is to report the results of your study or experiment without any type of subjective interpretation.
At a Glance
The results section is a vital part of an APA paper that summarizes a study's findings and statistical analysis. This section often includes descriptive text, tables, and figures to help summarize the findings.
The focus is purely on summarizing and presenting the findings and should not include any interpretation, since you'll cover that in the subsequent discussion section.
This article covers how to write an APA results section, including what to include and what to avoid.
The results section is the third section of a psychology paper. It will appear after the introduction and methods sections and before the discussion section.
The results section should include:
- A summary of the research findings.
- Information about participant flow, recruitment , retention, and attrition. If some participants started the study and later left or failed to complete the study, then this should be described.
- Information about any reasons why some data might have been excluded from the study.
- Statistical information including samples sizes and statistical tests that were used. It should report standard deviations, p-values, and other measures of interest.
Results Should Justify Your Claims
Report data in order to sufficiently justify your conclusions. Since you'll be talking about your own interpretation of the results in the discussion section, you need to be sure that the information reported in the results section justifies your claims.
When you start writing your discussion section, you can then look back on your results to ensure that all the data you need are there to fully support your conclusions. Be sure not to make claims in your discussion section that are not supported by the findings described in your results section.
Summarize Your Results
Remember, you are summarizing the results of your psychological study, not reporting them in full detail. The results section should be a relatively brief overview of your findings, not a complete presentation of every single number and calculation.
If you choose, you can create a supplemental online archive where other researchers can access the raw data if they choose.
How long should a results section be?
The length of your results section will vary depending on the nature of your paper and the complexity of your research. In most cases, this will be the shortest section of your paper.
Just as the results section of your psychology paper should sufficiently justify your claims, it should also provide an accurate look at what you found in your study. Be sure to mention all relevant information.
Don't omit findings simply because they failed to support your predictions.
Your hypothesis may have expected more statistically significant results or your study didn't support your hypothesis , but that doesn't mean that the conclusions you reach are not useful. Provide data about what you found in your results section, then save your interpretation for what the results might mean in the discussion section.
While your study might not have supported your original predictions, your finding can provide important inspiration for future explorations into a topic.
How is the results section different from the discussion section?
The results section provides the results of your study or experiment . The goal of the section is to report what happened and the statistical analyses you performed. The discussion section is where you will examine what these results mean and whether they support or fail to support your hypothesis.
Report Your Statistical Findings
Always assume that your readers have a solid understanding of statistical concepts. There's no need to explain what a t-test is or how a one-way ANOVA works. Your responsibility is to report the results of your study, not to teach your readers how to analyze or interpret statistics.
Include Effect Sizes
The Publication Manual of the American Psychological Association recommends including effect sizes in your results section so that readers can appreciate the importance of your study's findings.
Your results section should include both text and illustrations. Presenting data in this way makes it easier for readers to quickly look at your results.
Structure your results section around tables or figures that summarize the results of your statistical analysis. In many cases, the easiest way to accomplish this is to first create your tables and figures and then organize them in a logical way. Next, write the summary text to support your illustrative materials.
Only include tables and figures if you are going to talk about them in the body text of your results section.
In addition to knowing what you should include in the results section of your psychology paper, it's also important to be aware of things that you should avoid putting in this section:
Cause-and-Effect Conclusions
Don't draw cause-effect conclusions. Avoid making any claims suggesting that your result "proves" that something is true.
Interpretations
Present the data without editorializing it. Save your comments and interpretations for the discussion section of your paper.
Statistics Without Context
Don't include statistics without narration. The results section should not be a numbers dump. Instead, you should sequentially narrate what these numbers mean.
Don't include the raw data in the results section. The results section should be a concise presentation of the results. If there is raw data that would be useful, include it in the appendix .
Don't only rely on descriptive text. Use tables and figures to present these findings when appropriate. This makes the results section easier to read and can convey a great deal of information quickly.
Repeated Data
Don't present the same data twice in your illustrative materials. If you have already presented some data in a table, don't present it again in a figure. If you have presented data in a figure, don't present it again in a table.
All of Your Findings
Don't feel like you have to include everything. If data is irrelevant to the research question, don't include it in the results section.
But Don't Skip Relevant Data
Don't leave out results because they don't support your claims. Even if your data does not support your hypothesis, including it in your findings is essential if it's relevant.
More Tips for Writing a Results Section
If you are struggling, there are a few things to remember that might help:
- Use the past tense . The results section should be written in the past tense.
- Be concise and objective . You will have the opportunity to give your own interpretations of the results in the discussion section.
- Use APA format . As you are writing your results section, keep a style guide on hand. The Publication Manual of the American Psychological Association is the official source for APA style .
- Visit your library . Read some journal articles that are on your topic. Pay attention to how the authors present the results of their research.
- Get a second opinion . If possible, take your paper to your school's writing lab for additional assistance.
What This Means For You
Remember, the results section of your paper is all about providing the data from your study. This section is often the shortest part of your paper, and in most cases, the most clinical.
Be sure not to include any subjective interpretation of the results. Simply relay the data in the most objective and straightforward way possible. You can then provide your own analysis of what these results mean in the discussion section of your paper.
Bavdekar SB, Chandak S. Results: Unraveling the findings . J Assoc Physicians India . 2015 Sep;63(9):44-6. PMID:27608866.
Snyder N, Foltz C, Lendner M, Vaccaro AR. How to write an effective results section . Clin Spine Surg . 2019;32(7):295-296. doi:10.1097/BSD.0000000000000845
American Psychological Association. Publication Manual of the American Psychological Association (7th ed.). Washington DC: The American Psychological Association; 2019.
Purdue Online Writing Lab. APA sample paper: Experimental psychology .
Berkeley University. Reviewing test results .
Tuncel A, Atan A. How to clearly articulate results and construct tables and figures in a scientific paper ? Turk J Urol . 2013;39(Suppl 1):16-19. doi:10.5152/tud.2013.048
By Kendra Cherry, MSEd Kendra Cherry, MS, is a psychosocial rehabilitation specialist, psychology educator, and author of the "Everything Psychology Book."

- Langson Library
- Science Library
- Grunigen Medical Library
- Law Library
- Connect From Off-Campus
- Accessibility
- Gateway Study Center
Email this link
Writing a scientific paper.
- Writing a lab report
- INTRODUCTION
Writing a "good" results section
Figures and Captions in Lab Reports
"Results Checklist" from: How to Write a Good Scientific Paper. Chris A. Mack. SPIE. 2018.
Additional tips for results sections.
- LITERATURE CITED
- Bibliography of guides to scientific writing and presenting
- Peer Review
- Presentations
- Lab Report Writing Guides on the Web
This is the core of the paper. Don't start the results sections with methods you left out of the Materials and Methods section. You need to give an overall description of the experiments and present the data you found.
- Factual statements supported by evidence. Short and sweet without excess words
- Present representative data rather than endlessly repetitive data
- Discuss variables only if they had an effect (positive or negative)
- Use meaningful statistics
- Avoid redundancy. If it is in the tables or captions you may not need to repeat it
A short article by Dr. Brett Couch and Dr. Deena Wassenberg, Biology Program, University of Minnesota
- Present the results of the paper, in logical order, using tables and graphs as necessary.
- Explain the results and show how they help to answer the research questions posed in the Introduction. Evidence does not explain itself; the results must be presented and then explained.
- Avoid: presenting results that are never discussed; presenting results in chronological order rather than logical order; ignoring results that do not support the conclusions;
- Number tables and figures separately beginning with 1 (i.e. Table 1, Table 2, Figure 1, etc.).
- Do not attempt to evaluate the results in this section. Report only what you found; hold all discussion of the significance of the results for the Discussion section.
- It is not necessary to describe every step of your statistical analyses. Scientists understand all about null hypotheses, rejection rules, and so forth and do not need to be reminded of them. Just say something like, "Honeybees did not use the flowers in proportion to their availability (X2 = 7.9, p<0.05, d.f.= 4, chi-square test)." Likewise, cite tables and figures without describing in detail how the data were manipulated. Explanations of this sort should appear in a legend or caption written on the same page as the figure or table.
- You must refer in the text to each figure or table you include in your paper.
- Tables generally should report summary-level data, such as means ± standard deviations, rather than all your raw data. A long list of all your individual observations will mean much less than a few concise, easy-to-read tables or figures that bring out the main findings of your study.
- Only use a figure (graph) when the data lend themselves to a good visual representation. Avoid using figures that show too many variables or trends at once, because they can be hard to understand.
From: https://writingcenter.gmu.edu/guides/imrad-results-discussion
- << Previous: METHODS
- Next: DISCUSSION >>
- Last Updated: Aug 4, 2023 9:33 AM
- URL: https://guides.lib.uci.edu/scientificwriting
Off-campus? Please use the Software VPN and choose the group UCIFull to access licensed content. For more information, please Click here
Software VPN is not available for guests, so they may not have access to some content when connecting from off-campus.

An official website of the United States government
The .gov means it’s official. Federal government websites often end in .gov or .mil. Before sharing sensitive information, make sure you’re on a federal government site.
The site is secure. The https:// ensures that you are connecting to the official website and that any information you provide is encrypted and transmitted securely.
- Publications
- Account settings
- My Bibliography
- Collections
- Citation manager
Save citation to file
Email citation, add to collections.
- Create a new collection
- Add to an existing collection
Add to My Bibliography
Your saved search, create a file for external citation management software, your rss feed.
- Search in PubMed
- Search in NLM Catalog
- Add to Search
How to Write an Effective Results Section
Affiliation.
- 1 Rothman Orthopaedics Institute, Philadelphia, PA.
- PMID: 31145152
- DOI: 10.1097/BSD.0000000000000845
Developing a well-written research paper is an important step in completing a scientific study. This paper is where the principle investigator and co-authors report the purpose, methods, findings, and conclusions of the study. A key element of writing a research paper is to clearly and objectively report the study's findings in the Results section. The Results section is where the authors inform the readers about the findings from the statistical analysis of the data collected to operationalize the study hypothesis, optimally adding novel information to the collective knowledge on the subject matter. By utilizing clear, concise, and well-organized writing techniques and visual aids in the reporting of the data, the author is able to construct a case for the research question at hand even without interpreting the data.
PubMed Disclaimer
Similar articles
- How to Write Effective Discussion and Conclusion Sections. Makar G, Foltz C, Lendner M, Vaccaro AR. Makar G, et al. Clin Spine Surg. 2018 Oct;31(8):345-346. doi: 10.1097/BSD.0000000000000687. Clin Spine Surg. 2018. PMID: 29979216
- How to write an original radiological research manuscript. Bannas P, Reeder SB. Bannas P, et al. Eur Radiol. 2017 Nov;27(11):4455-4460. doi: 10.1007/s00330-017-4879-8. Epub 2017 Jun 14. Eur Radiol. 2017. PMID: 28616726 Free PMC article. Review.
- Rules to be adopted for publishing a scientific paper. Picardi N. Picardi N. Ann Ital Chir. 2016;87:1-3. Ann Ital Chir. 2016. PMID: 28474609
- The rites of writing papers: steps to successful publishing for psychiatrists. Brakoulias V, Macfarlane MD, Looi JC. Brakoulias V, et al. Australas Psychiatry. 2015 Feb;23(1):32-6. doi: 10.1177/1039856214560180. Epub 2014 Dec 2. Australas Psychiatry. 2015. PMID: 25469001
- How to write a research paper. Alexandrov AV. Alexandrov AV. Cerebrovasc Dis. 2004;18(2):135-8. doi: 10.1159/000079266. Epub 2004 Jun 23. Cerebrovasc Dis. 2004. PMID: 15218279 Review.
- Essential Guide to Manuscript Writing for Academic Dummies: An Editor's Perspective. Aga SS, Nissar S. Aga SS, et al. Biochem Res Int. 2022 Sep 1;2022:1492058. doi: 10.1155/2022/1492058. eCollection 2022. Biochem Res Int. 2022. PMID: 36092536 Free PMC article. Review.
- Search in MeSH
LinkOut - more resources
Full text sources.
- Ovid Technologies, Inc.
- Wolters Kluwer

- Citation Manager
NCBI Literature Resources
MeSH PMC Bookshelf Disclaimer
The PubMed wordmark and PubMed logo are registered trademarks of the U.S. Department of Health and Human Services (HHS). Unauthorized use of these marks is strictly prohibited.
An official website of the United States government
The .gov means it’s official. Federal government websites often end in .gov or .mil. Before sharing sensitive information, make sure you’re on a federal government site.
The site is secure. The https:// ensures that you are connecting to the official website and that any information you provide is encrypted and transmitted securely.
- Publications
- Account settings
Preview improvements coming to the PMC website in October 2024. Learn More or Try it out now .
- Advanced Search
- Journal List
- Turk J Urol
- v.39(Suppl 1); 2013 Sep
How to clearly articulate results and construct tables and figures in a scientific paper?
The writing of the results section of a scientific paper is very important for the readers for clearly understanding of the study. This review summarizes the rules for writing the results section of a scientific paper and describes the use of tables and figures.
Introduction
Medical articles consist of review articles, case reports, and letters to the editor which are prepared with the intention of publishing in journals related to the medical discipline of the author. For an academician to be able to progress in carreer, and make his/her activities known in the academic environment, require preparation of the protocol of his/her academic research article, and acquiring sufficient information, and experience related to the composition of this article. In this review article, the information related to the writing of the ‘Results’ section, and use of tables, and figures will be presented to the attention of the readers.
Writing the ‘Results’ section
The ‘Results’ section is perhaps the most important part of a research article. In fact the authors will share the results of their research/study with their readers. Renown British biologist Thomas Henry Huxley (1825–1895) indicated his feelings as “The great tragedy of science: the slaying of a beautiful hypothesis by an ugly fact.” which emphasizes the importance of accurately, and impressively written results.
In essence results provide a response for the question” What is found in the research performed?”. Therefore, it is the most vital part of the article. As a priority, while drafting the ‘Results’ section of a manuscript one should not firstly write down methods in the ‘Material and Method’ section. The first sentence should give information about the number of patients who met the inclusion criteria, and thus enrolled in the study. [ 1 ] Besides information about the number of patients excluded from the study, and the reasons for exclusion is very important in that they will enlighten the readers, and reviewers who critically evaluate the manuscript, and also reflect the seriousness of the study. On the other hand, the results obtained should be recorded in chronological order, and without any comments. [ 2 ] In this section use of simple present tense is more appropriate. The findings should be expressed in brief, lucid, and explicable words. The writing style should not be boring for the reader. During writing process of a research article, a generally ill-conceived point is that positive, and significant findings are more important, attractive, and valuable, while negative, and insignificant findings are worthless, and less attractive. A scientific research is not performed to confirm a hypothesis, rather to test it. Not only positive, and significant results are worth writing, on the other hand negative or statistically insignificant result which support fallacy of a widely accepted opinion might be valuable. Therefore, all findings obtained during research should be inclıuded in the ‘Results’ section. [ 1 ]
While writing the ‘Results’ section, the sequence of results, tabulated data, and information which will be illustrated as figures should be definitively indicated. In indicating insignificant changes, do not use expressions as “decreased” or “increased”, these words should be reserved for significant changes. If results related to more than one parameter would be reported, it is appropriate to write the results under the subheading of its related parameter so as to facilitate reading, and comprehension of information. [ 2 ] Only data, and information concerning the study in question should be included in the ‘Results’ section. Results not mentioned in this section should not be included in the ‘Discussion’ and ‘Summary’ sections. Since the results obtained by the authors are cited in the ‘Results’ section, any reference should not be indicated in this section. [ 3 ]
In the ‘Results’ section, numerical expressions should be written in technically appropriate terms. The number of digits (1, 2 or 3 digits) to be written after a comma (in Turkish) or a point (in especially American English) should be determined The number of digits written after the punctuation marks should not be changed all throughout the text. Data should be expressed as mean/median ± standard deviation. Data as age, and scale scores should be indicated together with ranges of values. Absolute numerical value corresponding to a percentage must be also indicated. P values calculated in statistical analysis should be expressed in their absolute values. While writing p values of statistically significant data, instead of p<0.05 the actual level of significance should be recorded. If p value is smaller than 0.001, then it can be written as p <0.01. [ 2 ] While writing the ‘Results’ section, significant data which should be recalled by the readers must be indicated in the main text. It will be appropriate to indicate other demographic numerical details in tables or figures.
As an example elucidating the abovementioned topics a research paper written by the authors of this review article, and published in the Turkish Journal of Urology in the year 2007 (Türk Üroloji Dergisi 2007;33:18–23) is presented below:
“A total of 9 (56.2%) female, and 7 (43.8%) male patients with were included in this study. Mean age of all the patients was 44.3±13.8 (17–65) years, and mean dimensions of the adrenal mass was 4.5±3.4 (1–14) cm. Mean ages of the male, and female patients were 44.1 (30–65), and 42.4 (17–64) years, while mean diameters of adrenal masses were 3.2 (1–5), and 4.5 (1–14) cm (p age =0.963, p mass size =0.206). Surgical procedures were realized using transperitoneal approach through Chevron incision in 1 (6.2%), and retroperitoneal approach using flank incision with removal of the 11. rib in 15 (93.7%) patients. Right (n=6; 37.5%), and left (n=2; 12.5%) adrenalectomies were performed. Two (12.5%) patients underwent bilateral adrenalectomy in the same session because of clinical Cushing’s syndrome persisted despite transsphenoidal hipophysectomy. Mean operative time, and length of the hospital stay were 135 (65–190) min, and 3 (2–6) days, respectively. While resecting 11. rib during retroperitoneal adrenalectomy performed in 1 patient, pleura was perforated for nearly 1.5 cm. The perforated region was drained, and closed intraoperatively with 4/0 polyglyctan sutures. The patient did not develop postoperative pneumothorax. In none of the patients postoperative complications as pneumothorax, bleeding, prolonged drainage were seen. Results of histopathological analysis of the specimens retrieved at the end of the operation were summarized in Table 1 .” Table 1. Histopathological examination results of the patients Histopathological diagnosis Men n (%) Women n (%) Total n (%) Adrenal cortical adenoma 5 (31.3) 6 (37.6) 11 (68.8) Pheochromocytoma 1 (6.2) 1 (6.2) 2 (12.6) Ganglioneuroma 1 (6.2) - 1 (6.2) Myelolipoma - 1 (6.2) 1 (6.2) Adrenal carcinoma - 1 (6.2) 1 (6.2) Total 7 (43.7) 9 (56.2) 16 (100) Open in a separate window
Use of tables, and figures
To prevent the audience from getting bored while reading a scientific article, some of the data should be expressed in a visual format in graphics, and figures rather than crowded numerical values in the text. Peer-reviewers frequently look at tables, and figures. High quality tables, and figures increase the chance of acceptance of the manuscript for publication.
Number of tables in the manuscript should not exceed the number recommended by the editorial board of the journal. Data in the main text, and tables should not be repeated many times. Tables should be comprehensible, and a reader should be able to express an opinion about the results just at looking at the tables without reading the main text. Data included in tables should comply with those mentioned in the main text, and percentages in rows, and columns should be summed up accurately. Unit of each variable should be absolutely defined. Sampling size of each group should be absolutely indicated. Values should be expressed as values±standard error, range or 95% confidence interval. Tables should include precise p values, and level of significance as assessed with statistical analysis should be indicated in footnotes. [ 2 ] Use of abbreviations in tables should be avoided, if abbreviations are required they should be defined explicitly in the footnotes or legends of the tables. As a general rule, rows should be arranged as double-spaced Besides do not use pattern coloring for cells of rows, and columns. Values included in tables should be correctly approximated. [ 1 , 2 ]
As an example elucidating the abovementioned topics a research paper written by the authors of this review article, and published in the Turkish Journal of Urology in the year 2007 (Türk Üroloji Dergisi 2007;33:18–23).is shown in Table 1 .
Most of the readers priorly prefer to look at figures, and graphs rather than reading lots of pages. Selection of appropriate types of graphs for demonstration of data is a critical decision which requires artist’s meticulousness. As is the case with tables, graphs, and figures should also disploay information not provided in the text. Bar, line, and pie graphs, scatter plots, and histograms are some examples of graphs. In graphs, independent variables should be represented on the horizontal, and dependent variables on the vertical axis. Number of subjects in every subgroup should be indicated The labels on each axis should be easily understandable. [ 2 ] The label of the Y axis should be written vertically from bottom to top. The fundamental point in writing explanatory notes for graphs, and figures is to help the readers understand the contents of them without referring to the main text. Meanings of abbreviations, and acronyms used in the graphs, and figures should be provided in explanatory notes. In the explanatory notes striking data should be emphasized. Statistical tests used, levels of significance, sampling size, stains used for analyses, and magnification rate should be written in order to facilitate comprehension of the study procedures. [ 1 , 2 ]
Flow diagram can be utilized in the ‘Results’ section. This diagram facilitates comprehension of the results obtained at certain steps of monitorization during the research process. Flow diagram can be used either in the ‘Results’ or ‘Material and Method’ section. [ 2 , 3 ]
Histopathological analyses, surgical technique or radiological images which are considered to be more useful for the comprehension of the text by the readers can be visually displayed. Important findings should be marked on photos, and their definitions should be provided clearly in the explanatory legends. [ 1 ]
As an example elucidating the abovementioned issues, graphics, and flow diagram in the ‘Results’ section of a research paper written by the authors of this review article, and published in the World Journal of Urology in the year 2010 (World J Urol 2010;28:17–22.) are shown in Figures 1 , and and2 2 .

a The mean SHIM scores of the groups before and after treatment. SHIM sexual health inventory for male. b The mean IPSS scores of the groups before and after treatment. IPSS international prostate symptom score

Flowchart showing patients’ progress during the study. SHIM sexual health inventory for male, IIEF international index of erectile function, IPSS international prostate symptom score, QoL quality of life, Q max maximum urinary flow rate. PRV post voiding residual urine volume
In conclusion, in line with the motto of the famous German physicist Albert Einstein (1879–1955). ‘If you are out to describe the truth, leave elegance to the tailor .’ results obtained in a scientific research article should be expressed accurately, and with a masterstroke of a tailor in compliance with certain rules which will ensure acceptability of the scientific manuscript by the editorial board of the journal, and also facilitate its intelligibility by the readers.
Organizing Academic Research Papers: 7. The Results
- Purpose of Guide
- Design Flaws to Avoid
- Glossary of Research Terms
- Narrowing a Topic Idea
- Broadening a Topic Idea
- Extending the Timeliness of a Topic Idea
- Academic Writing Style
- Choosing a Title
- Making an Outline
- Paragraph Development
- Executive Summary
- Background Information
- The Research Problem/Question
- Theoretical Framework
- Citation Tracking
- Content Alert Services
- Evaluating Sources
- Primary Sources
- Secondary Sources
- Tertiary Sources
- What Is Scholarly vs. Popular?
- Qualitative Methods
- Quantitative Methods
- Using Non-Textual Elements
- Limitations of the Study
- Common Grammar Mistakes
- Avoiding Plagiarism
- Footnotes or Endnotes?
- Further Readings
- Annotated Bibliography
- Dealing with Nervousness
- Using Visual Aids
- Grading Someone Else's Paper
- How to Manage Group Projects
- Multiple Book Review Essay
- Reviewing Collected Essays
- About Informed Consent
- Writing Field Notes
- Writing a Policy Memo
- Writing a Research Proposal
- Acknowledgements
The results section of the research paper is where you report the findings of your study based upon the information gathered as a result of the methodology [or methodologies] you applied. The results section should simply state the findings, without bias or interpretation, and arranged in a logical sequence. The results section should always be written in the past tense. A section describing results [a.k.a., "findings"] is particularly necessary if your paper includes data generated from your own research.
Importance of a Good Results Section
When formulating the results section, it's important to remember that the results of a study do not prove anything . Research results can only confirm or reject the research problem underpinning your study. However, the act of articulating the results helps you to understand the problem from within, to break it into pieces, and to view the research problem from various perspectives.
The page length of this section is set by the amount and types of data to be reported . Be concise, using non-textual elements, such as figures and tables, if appropriate, to present results more effectively. In deciding what data to describe in your results section, you must clearly distinguish material that would normally be included in a research paper from any raw data or other material that could be included as an appendix. In general, raw data should not be included in the main text of your paper unless requested to do so by your professor.
Avoid providing data that is not critical to answering the research question . The background information you described in the introduction section should provide the reader with any additional context or explanation needed to understand the results. A good rule is to always re-read the background section of your paper after you have written up your results to ensure that the reader has enough context to understand the results [and, later, how you interpreted the results in the discussion section of your paper].
Bates College; Burton, Neil et al. Doing Your Education Research Project . Los Angeles, CA: SAGE, 2008; Results . The Structure, Format, Content, and Style of a Journal-Style Scientific Paper. Department of Biology. Bates College.
Structure and Writing Style
I. Structure and Approach
For most research paper formats, there are two ways of presenting and organizing the results .
- Present the results followed by a short explanation of the findings . For example, you may have noticed an unusual correlation between two variables during the analysis of your findings. It is correct to point this out in the results section. However, speculating as to why this correlation exists, and offering a hypothesis about what may be happening, belongs in the discussion section of your paper.
- Present a section and then discuss it, before presenting the next section then discussing it, and so on . This is more common in longer papers because it helps the reader to better understand each finding. In this model, it can be helpful to provide a brief conclusion in the results section that ties each of the findings together and links to the discussion.
NOTE: The discussion section should generally follow the same format chosen in presenting and organizing the results.
II. Content
In general, the content of your results section should include the following elements:
- An introductory context for understanding the results by restating the research problem that underpins the purpose of your study.
- A summary of your key findings arranged in a logical sequence that generally follows your methodology section.
- Inclusion of non-textual elements, such as, figures, charts, photos, maps, tables, etc. to further illustrate the findings, if appropriate.
- In the text, a systematic description of your results, highlighting for the reader observations that are most relevant to the topic under investigation [remember that not all results that emerge from the methodology that you used to gather the data may be relevant].
- Use of the past tense when refering to your results.
- The page length of your results section is guided by the amount and types of data to be reported. However, focus only on findings that are important and related to addressing the research problem.
Using Non-textual Elements
- Either place figures, tables, charts, etc. within the text of the result, or include them in the back of the report--do one or the other but never do both.
- In the text, refer to each non-textual element in numbered order [e.g., Table 1, Table 2; Chart 1, Chart 2; Map 1, Map 2].
- If you place non-textual elements at the end of the report, make sure they are clearly distinguished from any attached appendix materials, such as raw data.
- Regardless of placement, each non-textual element must be numbered consecutively and complete with caption [caption goes under the figure, table, chart, etc.]
- Each non-textual element must be titled, numbered consecutively, and complete with a heading [title with description goes above the figure, table, chart, etc.].
- In proofreading your results section, be sure that each non-textual element is sufficiently complete so that it could stand on its own, separate from the text.
III. Problems to Avoid
When writing the results section, avoid doing the following :
- Discussing or interpreting your results . Save all this for the next section of your paper, although where appropriate, you should compare or contrast specific results to those found in other studies [e.g., "Similar to Smith [1990], one of the findings of this study is the strong correlation between motivation and academic achievement...."].
- Reporting background information or attempting to explain your findings ; this should have been done in your Introduction section, but don't panic! Often the results of a study point to the need to provide additional background information or to explain the topic further, so don't think you did something wrong. Revise your introduction as needed.
- Ignoring negative results . If some of your results fail to support your hypothesis, do not ignore them. Document them, then state in your discussion section why you believe a negative result emerged from your study. Note that negative results, and how you handle them, often provides you with the opportunity to write a more engaging discussion section, therefore, don't be afraid to highlight them.
- Including raw data or intermediate calculations . Ask your professor if you need to include any raw data generated by your study, such as transcripts from interviews or data files. If raw data is to be included, place it in an appendix or set of appendices that are referred to in the text.
- Be as factual and concise as possible in reporting your findings . Do not use phrases that are vague or non-specific, such as, "appeared to be greater or lesser than..." or "demonstrates promising trends that...."
- Presenting the same data or repeating the same information more than once . If you feel the need to highlight something, you will have a chance to do that in the discussion section.
- Confusing figures with tables . Be sure to properly label any non-textual elements in your paper. If you are not sure, look up the term in a dictionary.
Burton, Neil et al. Doing Your Education Research Project . Los Angeles, CA: SAGE, 2008; Caprette, David R. Writing Research Papers . Experimental Biosciences Resources. Rice University; Hancock, Dawson R. and Bob Algozzine. Doing Case Study Research: A Practical Guide for Beginning Researchers . 2nd ed. New York: Teachers College Press, 2011; Introduction to Nursing Research: Reporting Research Findings. Nursing Research: Open Access Nursing Research and Review Articles. (January 4, 2012); Reporting Research Findings. Wilder Research, in partnership with the Minnesota Department of Human Services. (February 2009); Results . The Structure, Format, Content, and Style of a Journal-Style Scientific Paper. Department of Biology. Bates College; Schafer, Mickey S. Writing the Results . Thesis Writing in the Sciences. Course Syllabus. University of Florida.
Writing Tip
Why Don't I Just Combine the Results Section with the Discussion Section?
It's not unusual to find articles in social science journals where the author(s) have combined a description of the findings from the study with a discussion about their implications. You could do this. However, if you are inexperienced writing research papers, consider creating two sections for each element in your paper as a way to better organize your thoughts and, by extension, your paper. Think of the results section as the place where you report what your study found; think of the discussion section as the place where you interpret your data and answer the "so what?" question. As you become more skilled writing research papers, you may want to meld the results of your study with a discussion of its implications.
- << Previous: Quantitative Methods
- Next: Using Non-Textual Elements >>
- Last Updated: Jul 18, 2023 11:58 AM
- URL: https://library.sacredheart.edu/c.php?g=29803
- QuickSearch
- Library Catalog
- Databases A-Z
- Publication Finder
- Course Reserves
- Citation Linker
- Digital Commons
- Our Website
Research Support
- Ask a Librarian
- Appointments
- Interlibrary Loan (ILL)
- Research Guides
- Databases by Subject
- Citation Help
Using the Library
- Reserve a Group Study Room
- Renew Books
- Honors Study Rooms
- Off-Campus Access
- Library Policies
- Library Technology
User Information
- Grad Students
- Online Students
- COVID-19 Updates
- Staff Directory
- News & Announcements
- Library Newsletter
My Accounts
- Interlibrary Loan
- Staff Site Login
FIND US ON

Research Paper Writing: 6. Results / Analysis
- 1. Getting Started
- 2. Abstract
- 3. Introduction
- 4. Literature Review
- 5. Methods / Materials
- 6. Results / Analysis
- 7. Discussion
- 8. Conclusion
- 9. Reference
Writing about the information
There are two sections of a research paper depending on what style is being written. The sections are usually straightforward commentary of exactly what the writer observed and found during the actual research. It is important to include only the important findings, and avoid too much information that can bury the exact meaning of the context.
The results section should aim to narrate the findings without trying to interpret or evaluate, and also provide a direction to the discussion section of the research paper. The results are reported and reveals the analysis. The analysis section is where the writer describes what was done with the data found. In order to write the analysis section it is important to know what the analysis consisted of, but does not mean data is needed. The analysis should already be performed to write the results section.
Written explanations
How should the analysis section be written?
- Should be a paragraph within the research paper
- Consider all the requirements (spacing, margins, and font)
- Should be the writer’s own explanation of the chosen problem
- Thorough evaluation of work
- Description of the weak and strong points
- Discussion of the effect and impact
- Includes criticism
How should the results section be written?
- Show the most relevant information in graphs, figures, and tables
- Include data that may be in the form of pictures, artifacts, notes, and interviews
- Clarify unclear points
- Present results with a short discussion explaining them at the end
- Include the negative results
- Provide stability, accuracy, and value
How the style is presented
Analysis section
- Includes a justification of the methods used
- Technical explanation
Results section
- Purely descriptive
- Easily explained for the targeted audience
- Data driven
Example of a Results Section
Publication Manual of the American Psychological Association Sixth Ed. 2010
- << Previous: 5. Methods / Materials
- Next: 7. Discussion >>
- Last Updated: Nov 7, 2023 7:37 AM
- URL: https://wiu.libguides.com/researchpaperwriting
How to Write a Results Section: Tips, Examples, and Guide

- Icon Calendar 18 May 2024
- Icon Page 5286 words
- Icon Clock 24 min read
When students organize their scholarly works, they need valid guidelines on how to write a results section of a research paper. In this case, the article offers critical insights, including all the parts of a research paper and how a results section differs from the others, the information that should be included, and how to organize it correctly. The guideline also teaches students the differences between qualitative and quantitative research results sections, including samples and templates indicating how to present the findings. In turn, it provides 8 dos and 8 don’ts of writing a results section and 20 tips that students should follow.
How to Write an Outstanding Results Section & Examples
Students should read scholarly texts habitually to equip themselves with knowledge of the requirements of high-standard papers. While these requirements are not similar for different types of papers , they have similar unique features. For example, it is standard for writers of various types of essays to create a clear thesis statement that provides direction on the content and a well-organized essay outline that follows a correct essay structure and allows one to organize ideas logically. In turn, the guideline on how to write a results section provides insights into the details students must address when writing this part, including all the other components of a research paper, the information essential to include, and its organization. Moreover, readers should view this article as an educational tool that empowers them to start writing a high-standard results section of a scientific research paper.

6 Main Sections of a Research Paper and Its Structure
A research paper is unique because it has sections with varying details about a specific study topic. For example, these sections include an introduction, literature review, research methodology, results, discussion, and conclusion. In this respect, a research paper is a comprehensive document that requires students’ total focus and dedication. Writers should use each section to provide information for readers to understand the essence and significance of research papers. Therefore, to write a quality results section, one must know how it differs from other scientific works and the information it must provide for readers. In turn, students should focus on the uniqueness of each section because it underscores its relevance in a research paper.
1️⃣ Introduction
The introduction is the first section of a research paper. As the title suggests, it aims to introduce the reader to the study problem under analysis. In this respect, there are critical details writers must provide in this section, including the research problem, the background of the investigation, the significance of the study, and the research question or hypothesis. Typically, research paper topics indicate study problems that students may use for writing their scholarly works. In turn, the background information addresses existing research and some gaps that writers intend to explore using bridge sentences in their current work. Moreover, the significance of the study must explain why the current scientific work is essential, and research question(s) or hypothesis(es) address what writers intend to prove through their work, either answering questions or validating null and alternative hypotheses. Thus, the introduction section of a research paper gives readers basic information about the writer’s scientific work. In turn, before the introduction, students can include an abstract or executive summary part, which means the overall summary of a research paper, but it is optional.
2️⃣ Review of the Existing Literature
A literature review is the second section of a research paper that examines existing evidence relating to a particular research paper problem. Depending on the topic, this section is robust because one must demonstrate an in-depth understanding of the research issue under review. More importantly, students must convince readers that they have investigated the evidence and found a gap by reviewing credible sources that justify their studies. The most significant detail that students should focus on when writing this section is to examine numerous reliable sources, including books, peer-reviewed academic articles, and reports by government agencies, to cite information and statistics relevant to the scientific problem or theoretical framework. Such information is essential in revealing the knowledge gap that justifies the current research work.
3️⃣ Research Methodology
Research methodology is the third section of a research paper and focuses on the methods that students use to conduct their research work. For example, scholars should understand that research work takes many forms or designs that determine the approach to take to execute their task. The two main designs are qualitative and quantitative studies, while research methods include descriptive, experimental, case study, and observation. Therefore, when writing this section, students must know they intend to give readers a roadmap for conducting their scientific work. Essential details include the study participants, how to identify them and their total number, how to collect data, and the data analysis procedure(s). The research design is the most important detail to consider because it determines all the other components of the research methodology section. Besides, this section tends to be longer than the introduction.
4️⃣ Results Section
A results section is the fourth part of a research paper and is where students outline the findings of their scientific work. Typically, this section is shorter than the previous one because its purpose is to provide readers with the outcomes of a research paper. As the title suggests, the details in this section should point to the findings only. Therefore, the issue that makes this results section unique is that writers do not provide details that contextualize their work but only those that indicate its outcomes. The information in this section underscores the purpose of the research work, including its ultimate objective.
5️⃣ Discussion
The fifth section of a research paper is a discussion part, where authors link the results of the study with the literature review. Ideally, the information in the section acts as a summary of a research paper that requires one to confirm that the findings are relevant to addressing the knowledge gap that writers expressed in the introduction and literature review. Typically, people show this linkage by indicating whether the results have answered the study question(s) or validated the hypothesis(es). Other essential details are the limitations of a research paper.
6️⃣ Conclusion
A conclusion is the last section of a research paper, and it reiterates the research question, how the findings impact the practice, such as nursing or psychology, and the need for conducting further studies to address unresolved questions. This last section summarizes a research paper and affects the reader’s perspective on the study problem.
Join our satisfied customers who have received perfect papers from Wr1ter Team.
Providing the Right Information When Writing a Results Section
A results section is about the findings of the research work only. As such, students should not address anything that does not relate to the study question(s) or hypothesis(es). Typically, the details in this section include data that writers present in tables, charts, graphs, or other visual figures as part of the text or separately on pages at the end of the document, such as acknowledgments or appendices. Another detail is a contextual analysis of the data to give readers a better understanding of how it relates to the research question(s) or hypothesis(es), expanding on the meaning of the information presented. Further essential details in the section are data corresponding to the research question(s) or hypothesis(es) and secondary findings, including secondary outcomes and subgroup analyses. All these details make a results section unique because it is where readers need to understand the essence of the scientific work.
🔸 How to Organize a Results Section
While the results section’s primary purpose is to communicate the findings of a research paper, students should know that they cannot copy-paste raw information without a good explanation. For example, the information in a results section must have a pattern demonstrating a logical organization of the study findings. The best way to organize such findings is to use headings following a logical order of the study questions or hypotheses and integrate data through charts, graphs, visuals, or tables thematically. In this respect, when writing a results section, writers must refer to the introduction to ensure the information aligns with what they said. An important detail to note is that the graphical presentation of the results’ data is not sufficient. However, students must mention the data through statements that allow readers to understand how the results answer the research question(s) or validate or invalidate hypothesis (es).
🔸 How to Organize Figures, Charts, or Other Visuals
A logical presentation of data requires students to organize all data figures by numbering them and citing the number in the paragraph to link the findings to a research question or hypothesis. The numbering format should follow the order in which the writer mentions the data in the text. One should also explain the methodology that led to each figure. For example, students should capture the following details:
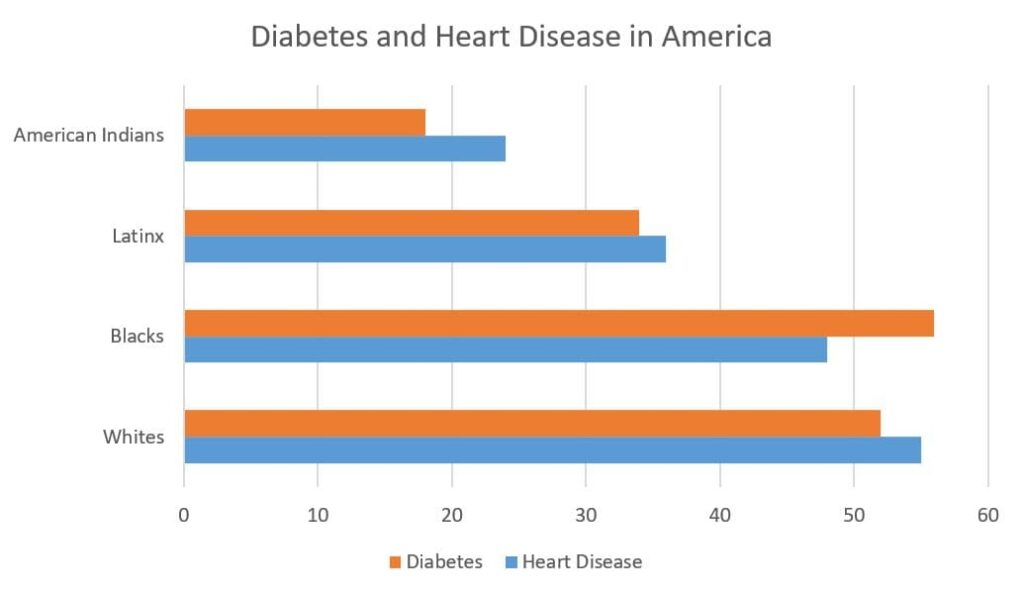
Figure 1: Racial/ethnic representation of health problems in the United States.
- Integrate the data into the text by mentioning the percentage of Whites, Blacks, Latinx, and American Indians with diabetes and heart disease.
- Mention Figure 1 but not necessarily the title. For example, one can write: “Figure 1 shows the proportion of Whites and Blacks with heart disease is 55 percent and 48 percent, respectively.” With that statement, readers can look at the chart and read its title to make sense of the sentence.
- Depending on the type of figure, writers can indicate the figure legend at the top. In the above example, it reads, “Diabetes and Heart Disease in America.”
- At the bottom of the figure (footnote), one should indicate the figure number followed by a caption that briefly describes the figure. In the above example, the caption reads, “Racial/ethnic representation of health problems in the United States.”
- Writers must use labels to identify specific elements or features in the graph. In the above example, the horizontal axis uses percentages as labels indicating the proportion of Whites, Blacks, Latinx, and American Indians with diabetes and heart disease.
🔸 How to Organize Tables
Like figures, tables capture data reflecting a results section of a research paper. However, they differ from charts in how they reflect the data. For example, their unique features include columns and rows, each with a subheading. The following example shows how students should use tables in a results section:
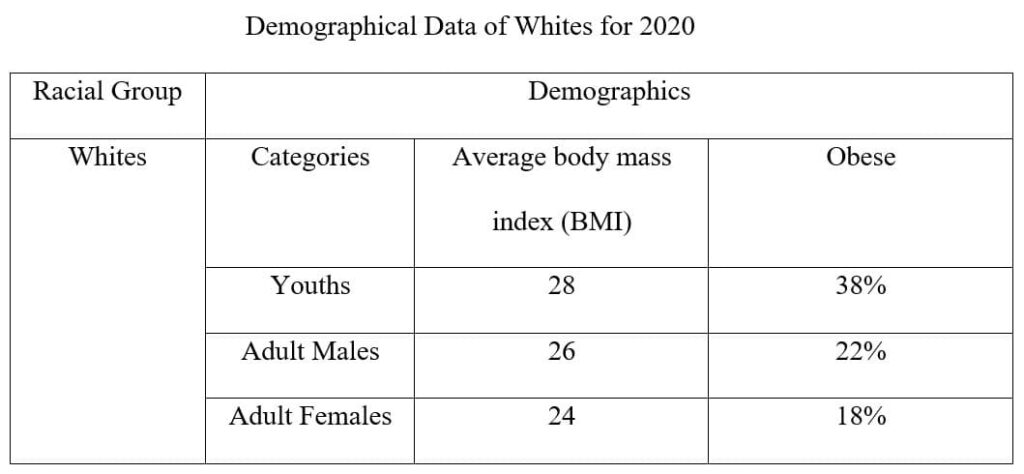
Table 1. Demographics of Whites in the United States for 2020 showing how obesity affects this population in the country. Young individuals are the most affected, with 38 percent presenting as obese, followed by adult females at 22 percent and then adult males at 18 percent. However, on average, the BMI index for all groups is below the obese level of 30.
- Writers should identify the data in the table above by mentioning “Table 1” in the text about the demographics of Whites for 2020.
- Typically, most research papers use a footnote rather than a table title. While a title is necessary to enhance readers’ understanding, footnotes are more detailed because they offer some analysis. In the above example, the footnote that follows the caption below the table analyzes the data for the reader’s benefit.
- Typically, the row headings capture groups, and column headings indicate demographical data. In the example above, the row heading captures Whites as a racial group, while the column heading indicates the group’s demographics. Writers should understand that each row and each column should reflect one group and one demographical data, respectively.
- Sometimes, writers may have row subheadings to indicate group categories and column subheadings to capture variables. In the above example, the row subheadings are youths, adult males, and adult females as the group categories, while the column subheadings indicate average BMI and obesity as demographic categories.
- Tables provide self-explanatory data to readers, and footnotes only attempt to make sense of it superficially. By looking at the table, people should comprehend the results without reading all the text.
Therefore, students should use figures and tables as focal points to communicate a clear and informative narrative about the findings of a research paper. In this respect, writers should repeat every detail in the text, although they must reference all data in a results section or other body paragraphs by pointing readers to “Table 1.”
How to Write a Good Results Section With 8 Dos and 8 Don’ts
When writing a great results section, students should know what to talk about or do and what not to talk about or not do. The things to do to demonstrate a high-standard results section and those not to do can affect the section’s quality. From this perspective, students must habitually read research papers to familiarize themselves with 8 dos and 8 don’ts of writing a results section.
What One Should Do When Writing a Results Section: 8 Dos
- Write in the past tense only . All study findings are what the author has established after conducting the actual study. The language that reflects this aspect is past tense. Common terminologies include ‘found,’ ‘established,’ and ‘confirmed.’ Using this language tells readers that the research has already happened and the outcomes are clear, as the text indicates through visuals, charts, graphs, figures, and tables.
- Write concisely. Findings require interpretation from statistical data to statistical analyses. Typically, this exercise involves complex language that may need to be clarified for readers. As such, students should write a results section clearly and concisely to avoid sending the wrong message to other scholars. For example, one must be clear about which finding relates to which study question or hypothesis.
- Referencing the study question(s) or hypothesis(es). A results section aims to answer the research question(s) or validate or invalidate the hypothesis(es). As such, students must refer to them (as applicable) when writing a results section. As stated, the best approach is to refer to them according to the order they appear in the introduction section for logical consistency.
- Begin with broad results. Typically, the findings of a research paper vary in how they answer the study question(s) or validate or invalidate the hypothesis(es). Some results are broad, requiring some comprehensive analysis, and others narrow, covering a brief mention. Students should begin with the general results because they affect the scientific question(s) or hypothesis(es) more than the narrow findings. However, they should mention the narrow findings later in the text because they are precise to the study question or hypothesis.
- Write the most critical findings from figures or tables. The purpose of figures and tables is to provide a broad picture of the results. However, only some details capture the most critical finding. For example, in the table above, the most critical finding is the rate of obesity in the White community, specifically youths, adult males, and adult females. When referring to Table 1, a student should mention the percentages of obesity prevalence in these groups as the most critical finding despite the chart indicating other details, such as the BMI, which are central to this crucial result.
- Avoid background information and explanation of findings. Students should avoid explaining the results or providing any background information. At this part of a research paper, readers already understand the background of the study because they have read the introduction and literature review sections. Consequently, they expect an in-depth explanation of the results in the later discussion section.
- Do not capture raw data or intermediate calculations. The findings in a results section should make sense to all readers. As such, students should not provide raw data or indicate its intermediate calculations. The data analysis section that falls in the research methodology offers the opportunity for these exercises. Therefore, students should understand that a results section should provide an answer to readers about the study question(s) or hypothesis(es), not leaving them with the task of analyzing the data to make the connection.
- Never ignore negative results. Authors of research papers probably have a biased interpretation of the results because they already have a preferred outcome. In such cases, most students may be tempted to ignore negative results if they do not conform to their expectations or preferences. However, they must understand that a results section should reflect the findings of a research paper regardless of whether they are positive or negative in their eyes. This capture of the results makes any research paper scholarly and valid.
What to Avoid: 8 Don’ts
- Do not capture all data generated in a research paper. Writers need to understand that the purpose of writing a results section is to answer the research question(s) or validate or invalidate the hypothesis(es). Doing so does not require all the data, but what is relevant for this task. Moreover, research papers have limited length, and one cannot have room in a results section to indicate all the data from the study experiment.
- Do not use text to describe everything. The purpose of charts, figures, visuals, and tables is to capture and present data in a short summary. As such, they help writers to avoid explaining every data and related detail because it may be complex and confusing to readers. Therefore, one should only describe or explain some things but use figures, visuals, and tables to present broad data.
- Do not repeat the data in figures and tables. When referring to figures, visuals, and tables in the text, students should avoid repeating every piece of data but instead interpret it for readers. What is important is the most critical data because it provides a clear and concise message about a research question or hypothesis. Therefore, students should interpret the data instead of repeating the same information as it is in the chart, visual, figure, or table. In the example of the table above, one should not repeat all the information but summarize it by stating the group most affected by obesity and how.
- Do not jump around the data to discuss the findings. The logical presentation of data requires students to provide information that answers the research questions or hypotheses as they appear in the introduction. As such, one should avoid mentioning data relevant to one question when answering a different question. The same case should apply to hypotheses.
- Do not give long explanations. A results section should be short but clear and concise. In this respect, students should refrain from long explanations because they reduce the space for the most essential information: critical findings. The best approach to avoid long descriptions is to use figures, visuals, charts, and tables.
- Do not use meaningless numbers. While a results section aims to show data mostly in numbers for a quantitative study, students should avoid using every number they have if it is not meaningful to a research question or hypothesis. Therefore, after data analysis, one should decide on the most relevant and meaningful numbers to include in a results section.
- Do not cite other research works. Since the purpose of a results section is to provide the findings of a research paper, one should avoid irrelevant details, including comparing the results to those of other research works. Students must understand that the discussion section gives them room to do so.
- Do not use the results of other authors. Any academic work is designed for a specific purpose. In this case, students must do their own research papers and present unique findings section, including negative or positive ones. The findings of other authors can be used only for a comparison of the results.
Examples of Results Sections for Qualitative and Quantitative Research Studies
The two primary research paper designs that scholars use for their scientific works are qualitative and quantitative studies. Each design has a unique way of capturing the findings of a research paper. The two examples below show how students should write a results section in qualitative and quantitative research papers. However, students must note the language and details, such as statistical data.
Example of a Qualitative Results Section
[Introductory context] A total of 98 respondents from different countries gave essential data by answering the survey questionnaire. The representation was as follows: 30 respondents were from the U.S. (30.6% of the total), 26 from China (26.5%), 22 from Russia (22.4%), and 20 from the United Kingdom (20.4%). […] [Important finding] According to the results, the most important cultural identifiers are language (w=0.3402), followed by ethnicity (w=0.2930) and religion (w=0.2279). Most respondents viewed gender as the most insignificant compared to the other three (w=0,1388) (Table 1). […] [Interesting Finding] An interesting finding is that the U.S. and the U.K. respondents considered sexual orientation as a determinant of a country’s cultural vibrancy, while those from China and Russia viewed it as an indicator of negative liberalism. All the respondents had a uniform consistency ratio (C.R.) of less than 0.08 (8%). [Another important finding] According to all the respondents, the three critical drivers of cultural vibrancy are technology (mean value of 4.88), education (4.60), contact with other cultures (4.40), and the media (4.30). Conversely, the factors that influence cultural assimilation the least, according to all the respondents, are cultural artifacts (2.88) and friendships (2.66) (Figure 1). […] [Summary of Key Findings] The findings indicate differences of opinion regarding some cultural topics and convergence of thought in others between countries from the respondents’ perspective. On differences, respondents from the U.S. and U.K. hold more liberal views than their Chinese and Russian counterparts. The point of convergence for all the respondents is the belief that culture is the most instrumental factor for interrogating the attitudes and behaviors of people .
[Introductory Context] The student data system for 2010 through 2020 was the source of the demographic data for the sample. The descriptive statistics include age, gender, grades, and course selection. Table 1 describes the cross-tabulation frequencies of the study sample. The mean age was 28.42 years, with a standard deviation of 8.22 years. The age range of the sample was from 18 to 50 years. [Relevant Finding] Overall, more students selected online than physical courses, with a uniform enrollment rate in online courses in both males and females; however, the proportion of males was high (62.7%) for online instruction than that of females (58.8%) as shown in Figures 1 and 2. […] [Significant Finding (including a significant test result)] A statistically significant difference in grades is reported between students enrolled in online classes and their counterparts in the traditional classroom setting. The mean and standard deviation for grades calculated by delivery type showed no significant difference between online and physical instruction. In contrast, those calculated by the instructor showed no significant difference in the mean grade. […] [Reference to Visual Data] Table 6 shows the impact of the delivery method and the instructor on students’ grades. […] The delivery method did not influence significant grade differences (F = 0.078, p = 0.780, df = 1, 811). The same case was reported for the instructor (F = 0.002, p = .967, df = 1, 811). The two factors had no significant interaction (F = 0.449, p = 0.503, df = 1, 811). [Relevant Finding] There is a statistically significant difference in student course retention between those taking online courses and their counterparts in physical classrooms (Supplementary Appendix Figure 1). Data were included for testing if a final grade was reported for a participant (Supplementary Appendix Figure 2). [Context to a Research Question or Hypothesis] The analysis of the contingency data was essential in confirming the hypothesis. Data organization indicates the row variable as course selection (online or physical classroom) and the column variable as retention in the course. [Explanation of a study Test] The chi-square testing (X2 = 2.524, p = .112, df = 1, 884) indicated no statistically significant difference between retention in online and physical classroom courses. [Significant Findings] The study includes a statistically significant difference in student retention between those who begin the program online and those who begin in the physical classroom. […] [Summary of Key Findings] Results from testing of H1 showed no significant difference between course grades for students enrolled in online courses and their counterparts in physical classroom courses. Chi-square testing of H2 indicated no significant difference in course retention between students taking online courses and those taking courses in the physical classroom environment. Chi-square testing of H3 indicated no significant difference in program retention between students who began the course online and those who began it in the physical classroom.
Enhance your academic performance with our top-notch, plagiarism-free papers.
Templates for Qualitative and Quantitative Results Sections
I. qualitative results template:.
- [Introductory Context]
- [Finding 1 – Important]
- [Finding 2 – Interesting]
- [Another Important Finding 3 that refers to a chart, figure, visual, or table]
- [Summary of key findings]
II. Quantitative Results Template:
- [Finding 1 – Relevant]
- [Finding 2 – Significant – with reference to a test result]
- [Reference to a chart, figure, visual, or table]
- [Finding 3 – Relevant]
- [Context to a Research Question or Hypothesis]
- [Explanation of a Study Test]
- [Finding 3 – Significant]
Looking at the two templates, it is evident that crucial details appear in all but some only in quantitative research. In both templates, students should introduce the section by stating some facts, such as the study sample, and enumerate the results, using charts, figures, visuals, or tables as necessary. However, only in a quantitative study, one should mention tests and their outcomes.
Comparing and Contrasting Qualitative and Quantitative Results Sections
There are areas of similarity and difference between the results sections of qualitative and quantitative research studies. The main similarities are that both results sections capture statistical data or reports and do not interpret the meanings of data with long explanations. However, there are many differences in presenting the content. Firstly, a qualitative results section emphasizes non-numerical, descriptive data, focusing on themes and ideas. In contrast, a quantitative results section highlights measurable (or quantifiable) numerical data relevant to interpreting trends, making predictions, running experiments, or testing hypotheses. Another difference is that a qualitative results section adopts descriptive and interpretive approaches to make sense of the collected data. On the other hand, a quantitative results section adopts numbers-based strategies, including statistics, calculations, and data measurements, to make sense of the collected data.
Research Questions and Hypotheses
When writing a results section, students must focus on the research question(s) or hypothesis(es) they stated in the introduction because they underscore the paper’s importance or purpose. Regarding research questions, the data presented in a results section must refer to the questions as they appear in the introduction, giving outcomes that reflect answers to these queries. Concerning hypotheses, students should ensure that a results section confirms or rejects them. In other words, a good results section should help readers to understand the scientific problem by answering the study question(s) or validating or invalidating the hypothesis(es). Therefore, when writing a results section, students should know that they are answering a specific research question or confirming a study hypothesis. This determination is crucial because it must reflect proper language, concepts, and terms used in the text.
20 Tips for Writing a Well-Organized Results Section
Based on the preceding sections, writing a high-standard results section of a research paper is a technical undertaking that requires students to grasp helpful insight. Some of the useful tips include always using simple and clear language, avoiding irrelevant expressions, discussing the findings objectively without overinterpretation, using sub-sections if there are more research questions or hypotheses, including negative results even if they do not support the study hypothesis, providing visuals charts, figures, visuals, and tables to document the results, and mentioning the tests and their outcomes for a quantitative study.
10 things to do when writing a results section include:
- briefly and precisely summarizing the results at the beginning of the section;
- using visual illustrations, like charts, figures, and tables;
- arranging the results logically;
- linking the data to the research question(s) or hypothesis(es);
- following clear, simple, and concise language;
- being objective;
- avoiding long explanations;
- including statistical analyses to make the data sensible to readers;
- providing the correct information for the right study question or hypothesis;
- presenting paragraphs that respond to different scientific questions or hypotheses.
10 things not to do when writing a results section include:
- using raw data;
- duplicating similar information by repeating the data in the visual illustrations within the text;
- including repetitive background information;
- constantly referring to the research methods;
- overlooking negative findings that do not support biases or invalid claims;
- providing charts, figures, visuals, or tables excessively;
- explaining the results comprehensively;
- presenting a findings section of other research papers as writers’ study results;
- failing to give graphs, figures, and tables a number;
- not mentioning a specific chart, figure, visual, or table number within the text.
Summing Up on How to Write a Perfect Results Section
- Start writing a results section by restating the purpose of a research paper.
- Use the past tense to describe the findings.
- Avoid vague language.
- Provide a clear, coherent, and logical explanation of all results without bias.
- Include the data that answers the research question(s) or validates or invalidates the hypothesis(es).
- Use useful and quality visual illustrations, like charts, figures, and tables.
- Present details about data analysis and interpretation and mention any statistical tests and their results.
- Report statistically insignificant findings to give a research paper credibility.
- Conclude with a short paragraph that summarizes the key findings.
- Proofread, revise, and edit a results section to eliminate any mistakes.
To Learn More, Read Relevant Articles

Understanding the Environmental Impact of Electric Vehicles
- Icon Calendar 21 August 2023
- Icon Page 902 words

Delving Into the Enigma of Alternate Universes: A Hypothetical Journey
- Icon Calendar 20 August 2023
- Icon Page 745 words
- Foundations
- Write Paper
Search form
- Experiments
- Anthropology
- Self-Esteem
- Social Anxiety
- Research Paper >
Writing a Results Section
The next stage of any research paper: writing the results section, announcing your findings to the world.
This article is a part of the guide:
- Outline Examples
- Example of a Paper
- Write a Hypothesis
- Introduction
Browse Full Outline
- 1 Write a Research Paper
- 2 Writing a Paper
- 3.1 Write an Outline
- 3.2 Outline Examples
- 4.1 Thesis Statement
- 4.2 Write a Hypothesis
- 5.2 Abstract
- 5.3 Introduction
- 5.4 Methods
- 5.5 Results
- 5.6 Discussion
- 5.7 Conclusion
- 5.8 Bibliography
- 6.1 Table of Contents
- 6.2 Acknowledgements
- 6.3 Appendix
- 7.1 In Text Citations
- 7.2 Footnotes
- 7.3.1 Floating Blocks
- 7.4 Example of a Paper
- 7.5 Example of a Paper 2
- 7.6.1 Citations
- 7.7.1 Writing Style
- 7.7.2 Citations
- 8.1.1 Sham Peer Review
- 8.1.2 Advantages
- 8.1.3 Disadvantages
- 8.2 Publication Bias
- 8.3.1 Journal Rejection
- 9.1 Article Writing
- 9.2 Ideas for Topics
In theory, this is the easiest part to write, because it is a straightforward commentary of exactly what you observed and found. In reality, it can be a little tricky, because it is very easy to include too much information and bury the important findings.

Too Much Information?
The results section is not for interpreting the results in any way; that belongs strictly in the discussion section. You should aim to narrate your findings without trying to interpret or evaluate them, other than to provide a link to the discussion section.
For example, you may have noticed an unusual correlation between two variables during the analysis of your results. It is correct to point this out in the results section.
Speculating why this correlation is happening, and postulating about what may be happening, belongs in the discussion section .
It is very easy to put too much information into the results section and obscure your findings underneath reams of irrelevance.
If you make a table of your findings, you do not need to insert a graph highlighting the same data. If you have a table of results, refer to it in the text, but do not repeat the figures - duplicate information will be penalized.
One common way of getting around this is to be less specific in the text. For example, if the result in table one shows 23.9%, you could write….
Table One shows that almost a quarter of…..

Tips for Writing a Results Section
Perhaps the best way to use the results section is to show the most relevant information in the graphs, figures and tables.
The text, conversely, is used to direct the reader to those, also clarifying any unclear points. The text should also act as a link to the discussion section, highlighting any correlations and findings and leaving plenty of open questions.
For most research paper formats , there are two ways of presenting and organizing the results. The first method is to present the results and add a short discussion explaining them at the end, before leading into the discussion proper.
This is very common where the research paper is straightforward, and provides continuity. The other way is to present a section and then discuss it, before presenting the next section with a short discussion. This is common in longer papers, and your discussion part of the paper will generally follow the same structure.
Be sure to include negative results - writing a results section without them not only invalidate the paper, but it is extremely bad science. The negative results, and how you handle them, often gives you the makings of a great discussion section, so do not be afraid to highlight them.
Using an Appendix to Streamline Writing the Results Section
If you condense your raw data down, there is no need to include the initial findings in the results, because this will simply confuse the reader.
If you are in doubt about how much to include, you can always insert your raw data into the appendix section, allowing others to follow your calculations from the start. This is especially useful if you have used many statistical manipulations, so that people can check your calculations and ensure that you have not made any mistakes.
In the age of spreadsheets, where the computer program prepares all of the calculations for you, this is becoming less common, although you should specify the program that you used and the version. On that note, it is unnecessary show your working - assume that the reader understands what a Chi Squared test, or a Students t-test is, and can perform it themselves.
Once you have a streamlined and informative results section, you can move onto the discussion section, where you begin to elaborate your findings.
- Psychology 101
- Flags and Countries
- Capitals and Countries
Martyn Shuttleworth (Mar 2, 2009). Writing a Results Section. Retrieved Jun 30, 2024 from Explorable.com: https://explorable.com/writing-a-results-section
You Are Allowed To Copy The Text
The text in this article is licensed under the Creative Commons-License Attribution 4.0 International (CC BY 4.0) .
This means you're free to copy, share and adapt any parts (or all) of the text in the article, as long as you give appropriate credit and provide a link/reference to this page.
That is it. You don't need our permission to copy the article; just include a link/reference back to this page. You can use it freely (with some kind of link), and we're also okay with people reprinting in publications like books, blogs, newsletters, course-material, papers, wikipedia and presentations (with clear attribution).
Want to stay up to date? Follow us!
Check out the official book.
Learn how to construct, style and format an Academic paper and take your skills to the next level.
(also available as ebook )
Save this course for later
Don't have time for it all now? No problem, save it as a course and come back to it later.
Footer bottom
- Privacy Policy

- Subscribe to our RSS Feed
- Like us on Facebook
- Follow us on Twitter
Training videos | Faqs
Results Section Examples and Writing Tips
Abstract | Introduction | Literature Review | Research question | Materials & Methods | Results | Discussion | Conclusion
In this blog, we look at how to write the results section of a research paper. We will go through plenty of results examples and understand how to construct a great results section for your research paper.
1. What is the purpose of the results section?

The authors report their findings in the results section. This is a relatively easy section to write. You simply have to organize your results and write them up in a logical sequence. You must present your findings without evaluating or interpreting them. You must try to illustrate your data using figures and tables to make it more accessible to the readers.
2. How should I structure my results section?
The results section of a research paper typically contains the following components:
Data pre-processing You can talk about any difficulties you encountered while collecting or processing the data.
Main findings You should present your main findings (both positive and negative) in a logical sequence.
Statistics You must use descriptive statistics and inferential statistics to present your data (mean, SD, CI etc.)
Figures and tables Use figures and tables to summarize large amounts of data in a visually pleasing way.
Trends and patterns Trends and patterns describe the general change in some variable in relation to another variable.
Reanalysis You can talk about any reanalysis of data you had to perform in order to reconfirm your findings.
3. Examples of results section
Let’s look at some examples of the results section. We will be looking at results section examples from different fields and of different formats. We have split this section into multiple components so that it is easy for you to understand.
3.1. An example of a pre-processing passage in the results section
Here is an example of the results section from an engineering research paper where the authors talk about pre-processing. The authors are saying that they performed a series of steps before conducting the actual analysis. They are saying that they filled in the missing data using linear interpolation. And then, they transformed and normalized the data. Finally, they applied data smoothing to remove any noise in the data. As you can see the authors are very transparent and are detailing everything they did to the data before the actual analysis.
The following is a brief summary of the preprocessing steps applied prior to analysis. The data were screened for outliers and such data points were set to missing. Subsequently, the missing data were filled by linear interpolation. The data were transformed using the Box method and then normalized to zero mean and unit standard deviation. The smoothing was applied at the final step to remove the noise in the data. _ Missing data _ Missing data fix _ Data normalization _ Data smoothing
3.2. An example of main findings passage in the results section
While presenting your findings you must clearly explain the following:
This is an example of the results section from a psychology research paper where authors are outlining their main findings. In this paper, the authors are investigating the effects of different types of music on people. The authors say that they found significant differences between classical and pop music in terms of memory recall. And then, they are saying that they did not find any differences in terms of emotional response. Finally, they are saying that they were quite surprised to find that both types of music fatigued the listeners at the same rate.
The results indicate significant differences between classical music and pop music in terms of their effects on memory recall and cognition (p<0.05). However, there was no significant difference across the groups for the emotional response to the music (p>0.05). It was surprising to find that both types of music elicited similar levels of fatigue in both groups (p>0.05). _ What was found? _ What was not found? _ Unexpected results
It is very clear from their tone that the last result was a bit unexpected. You can see that the authors have presented their findings in an unbiased manner without any interpretation. They have listed, the positive, the negative, and the neutral results logically in the text. This is how it should be done.
3.3. An example of using statistics in the results section
The use of relevant statistics is very important while writing your results section. It offers two benefits, number one, it will help you summarize the data in a meaningful way, and number two, it will make your text sound more credible. This results example is from a social sciences research paper investigating the relationship between social media and mental health. I want you to pay specific attention to the descriptive and inferential statistics used throughout the text.
The results of this study indicate significant differences in anxiety levels between high social media usage and moderate social media usage (p<0.05). The average time spent by high social media users (5.2 ± 2.2) was considerably higher than that of moderate social media users (3.2 ± 2.2). The odds of sleep disturbance were significantly greater for high social media users (odds ratio, 2.12; 95% CI, 1.81-2.17) compared to moderate social media users (odds ratio, 1.14; 95% CI, 1.07-1.18). _ p-values _ Standard deviation _ Odds ratio & confidence interval
The authors say that there is a significant difference in anxiety levels between high social media users and moderate social media users. Since the authors have used the word significant, they have specified the p-value of the statistical test they used to ascertain this. Then they are providing the actual values of the amount of time spent by both groups on social media. They have presented the data in the form, mean plus or minus standard deviation, which is the standard scientific way to represent this type of data. In the final statement, they talk about the odds of both groups experiencing sleep disturbances. They have provided the odds ratio along with the confidence intervals.
3.4. An example of using figures and tables in the results section
One of the important components of the results section is figures and tables. Try to present your data in figures and tables wherever necessary.
Here is a results example where authors are using figures and tables to describe their results. In the first couple of lines, they are talking about a trend in their data that relates to the change in temperature over time. They are constantly referring to the figure to get their point across to the readers. And finally, in the last sentence, they are telling the readers that the actual numerical data is provided in the table, and they can refer to it if they want. This is a standard way to use figures and tables in your research paper.
In Figure 1.1, the values are plotted as a function of time. The two peaks in the plot correspond to the maximum and minimum temperature values. The specific values obtained for each experiment are given in Table 2. _ Figure _ Figure info _ Table
3.5. An example of elaborating trends/patterns in the results section
As a researcher, it is your job to identify trends, patterns, and relationships between different variables in your data, and tell your readers about them. Because they can reveal very important evidence that you can use to answer your research questions or prove your hypothesis.
The temperature value increases until it reaches a peak value, then decreases rapidly to zero. This effect was 10 times larger at room temperature. There appears to be a positive association between temperature and time. _ Trend _ Pattern _ Interpreting the evidence
In this example, the author talks about his observation that the temperature changes over time in a certain pattern. Then the author talks about noticing the same behaviour under different conditions. Then based on the evidence, the author concludes that there is a positive association between time and temperature. The passage flows very well. You can clearly understand what the author is trying to say here.
4. Frequently Asked Questions
Most journals require separate results and discussion sections. So, it is very important that you are just reporting and describing your results without interpreting them in your results section. The interpretation of the results must be done in the discussion section.
Do not suppress negative results in your paper. Don’t worry if your experiments did not yield the results that you were expecting. Don’t try to ignore or downplay the result just because it doesn’t support your hypothesis. It doesn’t mean that your research is a failure. Negative results are as good as positive results. Actually, you have discovered a useful piece of evidence that your experiments don’t work
Here is an example of an author reporting negative and moderate results in the paper. This is perfectly fine. The authors have reported their results in the paper with full transparency and honesty. And that is how it should be.
The performance did not improve significantly with the new approach, though some marginal improvement was still achieved in terms of speed. These findings are in contrary to our original hypothesis. _ Moderate results _ Negative results
Most people skim through the paper just going through figures and tables without reading any text in the paper. So, captions should be as short as possible but detailed enough for the readers to understand the figure or table without having to read the text.
The best way to answer this question is if you want to illustrate the trends and patterns in the data, then a figure is the best option. If you want to show the actual values or present a lot of numerical information in your paper. Then, a table might be the best way to go.
The best way to answer this question is if you cannot present your data in your text in one or two lines, then you should consider putting it in a figure or a table.
You should write your results section in the past tense, because you are reporting the results of an experiment that you conducted in the past.
Similar Posts

The Best Order to Write a Research Paper
In this blog we will look at the perfect sequence for drafting a research manuscript.

How to Reuse a Method from a Previous Paper?
In this blog, we will look at how to replicate someone’s methodology in your paper.

Abstract Section Examples and Writing Tips
In this blog, we will go through many abstract examples and understand how to construct a good abstract for your research paper.

Writing a Medical Clinical Trial Research Paper – Example & Format
In this blog, we will teach you step-by-step how to write a clinical trial research paper for publication in a high quality scientific journal.

Hedging Techniques in Academic Writing with Examples
Hedging in academic writing refers to using language that indicates uncertainty or caution. Hedging can boost your credibility in the scientific world.

How to Handle Negative Results in your Research Paper?
In this blog, we will see how to effectively communicate negative and unexpected findings in your paper with detailed examples.
Leave a Reply Cancel reply
Your email address will not be published. Required fields are marked *
Save my name, email, and website in this browser for the next time I comment.
- 3 Share Facebook
- 1 Share Twitter
- 0 Share LinkedIn
- 2 Share Email
- How It Works
- PhD thesis writing
- Master thesis writing
- Bachelor thesis writing
- Dissertation writing service
- Dissertation abstract writing
- Thesis proposal writing
- Thesis editing service
- Thesis proofreading service
- Thesis formatting service
- Coursework writing service
- Research paper writing service
- Architecture thesis writing
- Computer science thesis writing
- Engineering thesis writing
- History thesis writing
- MBA thesis writing
- Nursing dissertation writing
- Psychology dissertation writing
- Sociology thesis writing
- Statistics dissertation writing
- Buy dissertation online
- Write my dissertation
- Cheap thesis
- Cheap dissertation
- Custom dissertation
- Dissertation help
- Pay for thesis
- Pay for dissertation
- Senior thesis
- Write my thesis
Results Section Of A Research Paper: How To Write It Properly

The results section of a research paper refers to the part that represents the study’s core findings from the methods that the researcher used to collect and analyze data. This section presents the results logically without interpretation or bias from the author.
Thus, this part of a research paper sets up the read for evaluation and analysis of the findings in the discussion section. Essentially, this section breaks down the information into several sentences, showing its importance to the research question. Writing results section in a research paper entails summarizing the gathered data and the performed statistical analysis. That way, the author presents or reports the results without subjective interpretation.
What Is The Results Section Of A Research Paper?
In its simplest definition, a research paper results section is where the researcher reports the findings of a study based on the applied methodology for gathering information. It’s the part where the author states the research findings in a logical sequence without interpreting them. If the research paper has data from actual research, this section should feature a detailed description of the results.
When writing a dissertation, a thesis, or any other academic paper, the result section should come third in sections’ sequence. It should follow the Methods and Materials presentation and the Discussion section comes after it. But most scientific papers present the Results and Discussion sections together. However, the results section answers the question, “What did your research uncover?”
Ideally, this section allows you to report findings in research paper, creating the basis for sufficiently justified conclusions. After writing the study findings in the results section, you interpret them in the subsequent discussion part. Therefore, your results section should report information that will justify your claims. That way, you can look back on the results section when writing the discussion part to ensure that your report supports your conclusions.
What Goes in the Results Section of a Research Paper?
This section should present results in research paper. The findings part of a research paper can differ in structure depending on the study, discipline, and journal. Nevertheless, the results section presents a description of the experiment while presenting the research results. When writing this part of your research paper, you can use graphs and tables if necessary.
However, state the findings without interpreting them. For instance, you can find a correlation between variables when analyzing data. In that case, your results section can explain this correlation without speculating about the causes of this correlation.
Here’s what to include in the results section of research paper:
A brief introductory of the context, repeating the research questions to help the readers understand the results A report about information collection, participants, and recruitment: for instance, you can include a demographic summary with the participants’ characteristics A systematic findings’ description, with a logical presentation highlighting relevant and crucial results A contextual data analysis explaining the meaning in sentences Information corresponding to the primary research questions Secondary findings like subgroup analysis and secondary outcomes Visual elements like charts, figures, tables, and maps, illustrating and summarizing the findings
Ensure that your results section cites and numbers visual elements in an orderly manner. Every table or figure should stand alone without text. That means visual elements should have adequate non-textual content to enable the audiences to understand their meanings.
If your study has a broad scope, several variables, or used methodologies that yielded different results, state the most relevant results only based on the research question you presented in your Introduction section.
The general rule is to leave out any data that doesn’t present your study’s direct outcome or findings. Unless the professor, advisor, university faulty, or your target journal requests you to combine the Results and Discussion sections, omit the interpretations and explanations of the results in this section.
How Long Should A Results Section Be?
The findings section of a research paper ranges between two and three pages, with tables, text, and figures. In most cases, universities and journals insist that this section shouldn’t exceed 1,000 words over four to nine paragraphs, usually with no references.
But a good findings section occupies 5% of the entire paper. For instance, this section should have 500 words if a dissertation has 10,000 words. If the educator didn’t specify the number of words to include in this chapter, use the data you collect to determine its length. Nevertheless, be as concise as possible by featuring only relevant results that answer your research question.
How To Write Results Section Of Research Paper
Perhaps, you have completed researching and writing the preceding sections, and you’re now wondering how to write results. By the time you’re composing this section, you already have findings or answers to your research questions. However, you don’t even know how to start a results section. And your search for guidelines landed you on this page.
Well, every research project is different and unique. That’s why researchers use different strategies when writing this section of their research papers. The scientific or academic discipline, specialization field, target journal, and the author are factors influencing how you write this section. Nevertheless, there’s a general way of writing this section, although it might differ slightly between disciplines. Here’s how to write results section in a research paper.
Check the instructions or guidelines. Check their instructions or guidelines first, whether you’re writing the research paper as part of your coursework or for an academic journal. These guidelines outline the requirements for presenting results in research papers. Also, check the published articles to know how to approach this section. When reviewing the procedures, check content restrictions and length. Essentially, learn everything you can about this section from the instructions or guidelines before you start writing. Reflect on your research findings. With instructions and guidelines in mind, reflect on your research findings to determine how to present them in your research paper. Decide on the best way to show the results so that they can answer the research question. Also, strive to clarify and streamline your report, especially with a complex and lengthy results section. You can use subheadings to avoid peripheral and excessive details. Additionally, consider breaking down the content to make it easy for the readers to understand or remember. Your hypothesis, research question, or methodologies might influence the structure of the findings sections. Nevertheless, a hierarchy of importance, chronological order, or meaningful grouping of categories or themes can be an effective way of presenting your findings. Design your visual presentations. Visual presentations improve the textual report of the research findings. Therefore, decide on the figures and styles to use in your tables, graphs, photos, and maps. However, check the instructions and guidelines of your faculty or journal to determine the visual aids you can use. Also, check what the guidelines say about their formats and design elements. Ideally, number the figures and tables according to their mention in the text. Additionally, your figures and tables should be self-explanatory. Write your findings section. Writing the results section of a research paper entails communicating the information you gathered from your study. Ideally, be as objective and factual as possible. If you gathered complex information, try to simplify and present it accurately, precisely, and clearly. Therefore, use well-structured sentences instead of complex expressions and phrases. Also, use an active voice and past tense since you’ve already done the research. Additionally, use correct spelling, grammar, and punctuation. Take your time to present the findings in the best way possible to focus your readers on your study objectives while preparing them for the coming speculations, interpretations, and recommendations. Edit Your Findings Section. Once you’ve written the results part of your paper, please go through it to ensure that you’ve presented your study findings in the best way possible. Make sure that the content of this section is factual, accurate, and without errors. You’ve taken a considerable amount of time to compose the results scientific paper audiences will find interesting to read. Therefore, take a moment to go through the draft and eliminate all errors.
Practical Tips on How to Write a Results Section of a Research Paper
The results part of a research paper aims to present the key findings objectively in a logical and orderly sequence using text and illustrative materials. A common mistake that many authors make is confusing the information in the discussion and the results sections. To avoid this, focus on presenting your research findings without interpreting them or speculating about them.
The following tips on how to write a results section should make this task easier for you:
Summarize your study results: Instead of reporting the findings in full detail, summarize them. That way, you can develop an overview of the results. Present relevant findings only: Don’t report everything you found during your research. Instead, present pertinent information only. That means taking time to analyze your results to know what your audiences want to know. Report statistical findings: When writing this section, assume that the audiences understand statistical concepts. Therefore, don’t try to explain the nitty-gritty in this section. Remember that your work is to report your study’s findings in this section. Be objective and concise: You can interpret the findings in the discussion sections. Therefore, focus on presenting the results objectively and concisely in this section. Use the suitable format: Use the correct style to present the findings depending on your study field.
Get Professional Help with the Research Section
Maybe you’re pursuing your graduate or undergraduate studies but cannot write the results part of your paper. Perhaps, you’re done researching and analyzing information, but this section proves too tricky for you to write. Well, you’re not alone because many students across the world struggle to present their research findings.
Luckily, our highly educated, talented, and experienced writers are always ready to assist such learners. If you are stuck with the results part of your paper, our professionals can help you . We offer high-quality, custom writing help online. We’re a reliable team of experts with a sterling reputation for providing comprehensive assistance to college, high school, and university learners. We deliver highly informative academic papers after conducting extensive and in-depth research. Contact us saying something like, “please do my thesis” to get quality help with your paper!

Leave a Reply Cancel reply
Your email address will not be published. Required fields are marked *
Comment * Error message
Name * Error message
Email * Error message
Save my name, email, and website in this browser for the next time I comment.
As Putin continues killing civilians, bombing kindergartens, and threatening WWIII, Ukraine fights for the world's peaceful future.
Ukraine Live Updates
Purdue Online Writing Lab Purdue OWL® College of Liberal Arts
Writing a Research Paper

Welcome to the Purdue OWL
This page is brought to you by the OWL at Purdue University. When printing this page, you must include the entire legal notice.
Copyright ©1995-2018 by The Writing Lab & The OWL at Purdue and Purdue University. All rights reserved. This material may not be published, reproduced, broadcast, rewritten, or redistributed without permission. Use of this site constitutes acceptance of our terms and conditions of fair use.
The Research Paper
There will come a time in most students' careers when they are assigned a research paper. Such an assignment often creates a great deal of unneeded anxiety in the student, which may result in procrastination and a feeling of confusion and inadequacy. This anxiety frequently stems from the fact that many students are unfamiliar and inexperienced with this genre of writing. Never fear—inexperience and unfamiliarity are situations you can change through practice! Writing a research paper is an essential aspect of academics and should not be avoided on account of one's anxiety. In fact, the process of writing a research paper can be one of the more rewarding experiences one may encounter in academics. What is more, many students will continue to do research throughout their careers, which is one of the reasons this topic is so important.
Becoming an experienced researcher and writer in any field or discipline takes a great deal of practice. There are few individuals for whom this process comes naturally. Remember, even the most seasoned academic veterans have had to learn how to write a research paper at some point in their career. Therefore, with diligence, organization, practice, a willingness to learn (and to make mistakes!), and, perhaps most important of all, patience, students will find that they can achieve great things through their research and writing.
The pages in this section cover the following topic areas related to the process of writing a research paper:
- Genre - This section will provide an overview for understanding the difference between an analytical and argumentative research paper.
- Choosing a Topic - This section will guide the student through the process of choosing topics, whether the topic be one that is assigned or one that the student chooses themselves.
- Identifying an Audience - This section will help the student understand the often times confusing topic of audience by offering some basic guidelines for the process.
- Where Do I Begin - This section concludes the handout by offering several links to resources at Purdue, and also provides an overview of the final stages of writing a research paper.
More From Forbes
7 chatgpt prompts to improve your writing.
- Share to Facebook
- Share to Twitter
- Share to Linkedin
Photo by NICOLAS MAETERLINCK/BELGA MAG/AFP via Getty Images
On writing , author David Sedaris once said, “You need to do the best that you can do, and then you need to take the best that you can do and you need to rewrite it, and rewrite it, and rewrite it.” That’s the dynamic essence of the writing process. Writers refine their drafts, just like they continually refine their craft. I didn’t study writing or literature, so I was intimidated when I began contributing to major publications. But my confidence grew with each byline, and I began to find my voice.
While ChatGPT can be an impressive imitator, it can never generate your unique voice and perspective. It can, however, be a powerful tool for improving your writing, whether you’re penning business articles or important emails. It all starts with the right prompts.
Here are seven that you can use to level up your writing skills.
Automate Your Busywork
There are no shortcuts to becoming a better writer. The prolific author Stephen King once said, “If you want to be a writer, you must do two things above all others: read a lot and write a lot.” That said, you can use AI tools to eliminate some of the tedious tasks involved in writing and leave more time for honing your craft. Here are some prompts to delegate your writing “busywork” to ChatGPT.
1. Generating Ideas And Topics
AI shouldn’t do your writing for you. It lacks the necessary human context and isn’t immune to errors. But it can be a powerful writing partner. As Wharton professor Christian Terwiesch (who challenged ChatGPT to come up with product ideas and compared those ideas to student ideas —ChatGPT won), has said , “Everybody should be using ChatGPT to help them generate ideas.” At worst, you reject all of them. At best, you enrich your pool of ideas.
Best High-Yield Savings Accounts Of 2024
Best 5% interest savings accounts of 2024.
Here is a prompt you can use to help get the idea wheels turning:
"I'm an [role/title] writing for [outlet description] targeting [target audience]. Can you suggest some fresh and engaging topics that would appeal to this audience?"
If you’d like ideas related to a certain topic or tailored to a specific style (e.g., a “hot take” versus a personal essay), remember: the more context you provide, the more concise the results.
2. Editing For Grammar And Style
Whether you’re sending an email or publishing an article on a high-traffic website, typos are an embarrassing—and avoidable—faux pas. In today’s world, where internet content exists in perpetuity, anything attached to your name should be error-free. ChatGPT can be a near-instantaneous proofreader. Test out the following prompt:
"Can you proofread this [content] for grammar, punctuation, and style consistency? The intended audience is [audience/recipient]. Please provide a list of any suggested improvements.”
3. Hitting The Right Tone
Spelling and grammar are a crucial part of editing, but they’re relatively objective. Perfecting the tone is more subjective and sometimes more challenging—but just as crucial.
The proper tone can ensure that your text is engaging. It can foster trust and understanding with colleagues and business partners. It can persuade your audience to get on board with your viewpoint. Writing that misses the mark on tone, however, can cause misunderstandings, hurt feelings, damage your credibility, and lose your reader’s interest.
With that in mind, here’s a prompt that can help you achieve the right tone in your writing:
"Can you help me rewrite this [content] for [audience], ensuring it maintains a [describe the desired tone]?
Add context to make ChatGPT’s reply more helpful. For example, if your content should show sensitivity to a certain issue or audience, add it to the prompt.
4. Adding Data And Research
One lesson I’ve learned from contributing to Forbes and other widely-read publications is that my word alone is rarely enough. I can share my personal experiences, but research and data can strengthen any piece of writing.
Instead of researching the traditional way—reviewing your writing and identifying facts that need outside sourcing, then Googling for relevant insight—ChatGPT can speed up the process, leaving you more time to polish those personal anecdotes. Try this prompt:
"I’m writing [describe the content and subject matter] for [target audience] and want to include relevant data and research. Can you review the following text and provide researched-backed statistics and insights on this topic?"
Importantly, always check the sources that ChatGPT generates. It will almost certainly come up with helpful results but they’re not always accurate—that’s where you, human editor, come into play.
Refine Your Craft
To continually improve your writing skills, you can take a page from the habits of professional writers. The following prompts can help you develop practices to become a stronger writer.
5. Daily Writing Prompts
I’ve written before about my morning pages . It’s a great way to clear my head before the day begins and to practice fluidly translating my thoughts into words on paper. If a blank page feels intimidating, writing prompts are a great way to get started. ChatGPT can generate writing prompts in an instant. You can keep it general:
“Can you suggest a couple of writing prompts that I can use to practice the craft of writing?”
Or, if you have a goal in mind, add more context. For example:
“I'm trying to improve engagement with my readers. Can you generate a couple of writing prompts to practice writing engaging content?”
6. Experiment With Different Styles And Voices
If you call your grandmother on the telephone, I’d bet your voice and speaking style sound vastly different from when you’re chatting with your best friend. Writing is the same.
ChatGPT can help you practice toggling between different styles and voices, and in doing so, help you find yours. You can ask ChatGPT for writing prompts to practice a certain style. For example:
“Can you generate three short exercises to help me practice writing in different voices and styles?”
ChatGPT will not only generate exercises, it will also break down the structure and elements of different writing styles and specify the tone.
Or, you can submit text to ChatGPT and ask it to analyze the style and voice. Try this prompt:
“Can you analyze the voice and style of the following text: [insert text].”
I used this prompt to assess the introduction to one of my recent Forbes stories, and ChatGPT said it was “Conversational and Relatable,” “Encouraging and Reassuring,” and “Informative and Practical”—encouraging feedback from my AI editor.
7. Rewrite, Rewrite, Rewrite
In A Moveable Feast , Ernest Hemingway wrote, “The only kind of writing is rewriting.”
If you want to become a writer, you have to embrace rewriting, whether you’re retyping every word or pouring over (and over) a Google Doc draft. Here are a couple of prompts you can use so that ChatGPT can assist in the rewriting process, one excerpt at a time:
“Rewrite this paragraph in the style of [Ernest Hemingway or any other author]."
“Rewrite this introduction so that it sounds like a story in [publication]”
“Rewrite this email so that it will resonate with [audience].”
“Rewrite this paragraph for clarity and concision.”
Importantly, ChatGPT only does part of the work. It falls to the writer to analyze the results, apply those lessons in future drafts, and, of course, to keep writing.

- Editorial Standards
- Reprints & Permissions
Join The Conversation
One Community. Many Voices. Create a free account to share your thoughts.
Forbes Community Guidelines
Our community is about connecting people through open and thoughtful conversations. We want our readers to share their views and exchange ideas and facts in a safe space.
In order to do so, please follow the posting rules in our site's Terms of Service. We've summarized some of those key rules below. Simply put, keep it civil.
Your post will be rejected if we notice that it seems to contain:
- False or intentionally out-of-context or misleading information
- Insults, profanity, incoherent, obscene or inflammatory language or threats of any kind
- Attacks on the identity of other commenters or the article's author
- Content that otherwise violates our site's terms.
User accounts will be blocked if we notice or believe that users are engaged in:
- Continuous attempts to re-post comments that have been previously moderated/rejected
- Racist, sexist, homophobic or other discriminatory comments
- Attempts or tactics that put the site security at risk
- Actions that otherwise violate our site's terms.
So, how can you be a power user?
- Stay on topic and share your insights
- Feel free to be clear and thoughtful to get your point across
- ‘Like’ or ‘Dislike’ to show your point of view.
- Protect your community.
- Use the report tool to alert us when someone breaks the rules.
Thanks for reading our community guidelines. Please read the full list of posting rules found in our site's Terms of Service.
Suggestions or feedback?
MIT News | Massachusetts Institute of Technology
- Machine learning
- Social justice
- Black holes
- Classes and programs
Departments
- Aeronautics and Astronautics
- Brain and Cognitive Sciences
- Architecture
- Political Science
- Mechanical Engineering
Centers, Labs, & Programs
- Abdul Latif Jameel Poverty Action Lab (J-PAL)
- Picower Institute for Learning and Memory
- Lincoln Laboratory
- School of Architecture + Planning
- School of Engineering
- School of Humanities, Arts, and Social Sciences
- Sloan School of Management
- School of Science
- MIT Schwarzman College of Computing
Technique improves the reasoning capabilities of large language models
Press contact :, media download.

*Terms of Use:
Images for download on the MIT News office website are made available to non-commercial entities, press and the general public under a Creative Commons Attribution Non-Commercial No Derivatives license . You may not alter the images provided, other than to crop them to size. A credit line must be used when reproducing images; if one is not provided below, credit the images to "MIT."

Previous image Next image
Large language models like those that power ChatGPT have shown impressive performance on tasks like drafting legal briefs, analyzing the sentiment of customer reviews, or translating documents into different languages.
These machine-learning models typically use only natural language to process information and answer queries, which can make it difficult for them to perform tasks that require numerical or symbolic reasoning.
For instance, a large language model might be able to memorize and recite a list of recent U.S. presidents and their birthdays, but that same model could fail if asked the question “Which U.S. presidents elected after 1950 were born on a Wednesday?” (The answer is Jimmy Carter.)
Researchers from MIT and elsewhere have proposed a new technique that enables large language models to solve natural language, math and data analysis, and symbolic reasoning tasks by generating programs.
Their approach, called natural language embedded programs (NLEPs), involves prompting a language model to create and execute a Python program to solve a user’s query, and then output the solution as natural language.
They found that NLEPs enabled large language models to achieve higher accuracy on a wide range of reasoning tasks. The approach is also generalizable, which means one NLEP prompt can be reused for multiple tasks.
NLEPs also improve transparency, since a user could check the program to see exactly how the model reasoned about the query and fix the program if the model gave a wrong answer.
“We want AI to perform complex reasoning in a way that is transparent and trustworthy. There is still a long way to go, but we have shown that combining the capabilities of programming and natural language in large language models is a very good potential first step toward a future where people can fully understand and trust what is going on inside their AI model,” says Hongyin Luo PhD ’22, an MIT postdoc and co-lead author of a paper on NLEPs .
Luo is joined on the paper by co-lead authors Tianhua Zhang, a graduate student at the Chinese University of Hong Kong; and Jiaxin Ge, an undergraduate at Peking University; Yoon Kim, an assistant professor in MIT’s Department of Electrical Engineering and Computer Science and a member of the Computer Science and Artificial Intelligence Laboratory (CSAIL); senior author James Glass, senior research scientist and head of the Spoken Language Systems Group in CSAIL; and others. The research will be presented at the Annual Conference of the North American Chapter of the Association for Computational Linguistics.
Problem-solving with programs
Many popular large language models work by predicting the next word, or token, given some natural language input. While models like GPT-4 can be used to write programs, they embed those programs within natural language, which can lead to errors in the program reasoning or results.
With NLEPs, the MIT researchers took the opposite approach. They prompt the model to generate a step-by-step program entirely in Python code, and then embed the necessary natural language inside the program.
An NLEP is a problem-solving template with four steps. First, the model calls the necessary packages, or functions, it will need to solve the task. Step two involves importing natural language representations of the knowledge the task requires (like a list of U.S. presidents’ birthdays). For step three, the model implements a function that calculates the answer. And for the final step, the model outputs the result as a line of natural language with an automatic data visualization, if needed.
“It is like a digital calculator that always gives you the correct computation result as long as the program is correct,” Luo says.
The user can easily investigate the program and fix any errors in the code directly rather than needing to rerun the entire model to troubleshoot.
The approach also offers greater efficiency than some other methods. If a user has many similar questions, they can generate one core program and then replace certain variables without needing to run the model repeatedly.
To prompt the model to generate an NLEP, the researchers give it an overall instruction to write a Python program, provide two NLEP examples (one with math and one with natural language), and one test question.
“Usually, when people do this kind of few-shot prompting, they still have to design prompts for every task. We found that we can have one prompt for many tasks because it is not a prompt that teaches LLMs to solve one problem, but a prompt that teaches LLMs to solve many problems by writing a program,” says Luo.
“Having language models reason with code unlocks many opportunities for tool use, output validation, more structured understanding into model's capabilities and way of thinking, and more,” says Leonid Karlinsky, principal scientist at the MIT-IBM Watson AI Lab.
“No magic here”
NLEPs achieved greater than 90 percent accuracy when prompting GPT-4 to solve a range of symbolic reasoning tasks, like tracking shuffled objects or playing a game of 24, as well as instruction-following and text classification tasks. The researchers found that NLEPs even exhibited 30 percent greater accuracy than task-specific prompting methods. The method also showed improvements over open-source LLMs.
Along with boosting the accuracy of large language models, NLEPs could also improve data privacy. Since NLEP programs are run locally, sensitive user data do not need to be sent to a company like OpenAI or Google to be processed by a model.
In addition, NLEPs can enable small language models to perform better without the need to retrain a model for a certain task, which can be a costly process.
“There is no magic here. We do not have a more expensive or fancy language model. All we do is use program generation instead of natural language generation, and we can make it perform significantly better,” Luo says.
However, an NLEP relies on the program generation capability of the model, so the technique does not work as well for smaller models which have been trained on limited datasets. In the future, the researchers plan to study methods that could make smaller language models generate more effective NLEPs. In addition, they want to investigate the impact of prompt variations on NLEPs to enhance the robustness of the model’s reasoning processes.
This research was supported, in part, by the Center for Perceptual and Interactive Intelligence of Hong Kong.
Share this news article on:
Related links.
- Hongyin Luo
- Computer Science and Artificial Intelligence Laboratory (CSAIL)
- Department of Electrical Engineering and Computer Science
Related Topics
- Computer science and technology
- Artificial intelligence
- Programming
- Electrical Engineering & Computer Science (eecs)
Related Articles

Natural language boosts LLM performance in coding, planning, and robotics

Large language models use a surprisingly simple mechanism to retrieve some stored knowledge

Explained: Generative AI

Learning to grow machine-learning models
Previous item Next item
More MIT News

From group stretches to “Hitting Roman,” MIT Motorsports traditions live on
Read full story →

Faces of MIT: Anthony Hallee-Farrell '13

Creating the crossroads

Study reveals why AI models that analyze medical images can be biased

Leaning into the immune system’s complexity

Scientists use computational modeling to guide a difficult chemical synthesis
- More news on MIT News homepage →
Massachusetts Institute of Technology 77 Massachusetts Avenue, Cambridge, MA, USA
- Map (opens in new window)
- Events (opens in new window)
- People (opens in new window)
- Careers (opens in new window)
- Accessibility
- Social Media Hub
- MIT on Facebook
- MIT on YouTube
- MIT on Instagram
IMAGES
VIDEO
COMMENTS
Checklist: Research results 0 / 7. I have completed my data collection and analyzed the results. I have included all results that are relevant to my research questions. I have concisely and objectively reported each result, including relevant descriptive statistics and inferential statistics. I have stated whether each hypothesis was supported ...
Research results refer to the findings and conclusions derived from a systematic investigation or study conducted to answer a specific question or hypothesis. These results are typically presented in a written report or paper and can include various forms of data such as numerical data, qualitative data, statistics, charts, graphs, and visual aids.
Reporting Research Results in APA Style | Tips & Examples. Published on December 21, 2020 by Pritha Bhandari.Revised on January 17, 2024. The results section of a quantitative research paper is where you summarize your data and report the findings of any relevant statistical analyses.. The APA manual provides rigorous guidelines for what to report in quantitative research papers in the fields ...
Step 1: Consult the guidelines or instructions that the target journal or publisher provides authors and read research papers it has published, especially those with similar topics, methods, or results to your study. The guidelines will generally outline specific requirements for the results or findings section, and the published articles will ...
The results section of a research paper tells the reader what you found, while the discussion section tells the reader what your findings mean. The results section should present the facts in an academic and unbiased manner, avoiding any attempt at analyzing or interpreting the data. Think of the results section as setting the stage for the ...
Wilder Research, in partnership with the Minnesota Department of Human Services. (February 2009); Results. The Structure, Format, Content, and Style of a Journal-Style Scientific Paper. Department of Biology. Bates College; Schafer, Mickey S. Writing the Results. Thesis Writing in the Sciences. Course Syllabus. University of Florida.
Practical guidance for writing an effective results section for a research paper. Always use simple and clear language. Avoid the use of uncertain or out-of-focus expressions. The findings of the study must be expressed in an objective and unbiased manner. While it is acceptable to correlate certain findings in the discussion section, it is ...
Build coherence along this section using goal statements and explicit reasoning (guide the reader through your reasoning, including sentences of this type: 'In order to…, we performed….'; 'In view of this result, we ….', etc.). In summary, the general steps for writing the Results section of a research article are:
As you are writing your results section, keep a style guide on hand. The Publication Manual of the American Psychological Association is the official source for APA style. Visit your library. Read some journal articles that are on your topic. Pay attention to how the authors present the results of their research. Get a second opinion. If ...
Chris A. Mack. SPIE. 2018. Present the results of the paper, in logical order, using tables and graphs as necessary. Explain the results and show how they help to answer the research questions posed in the Introduction. Evidence does not explain itself; the results must be presented and then explained. Avoid: presenting results that are never ...
The results section is where you report the main findings of your research. Watch this video to learn how to report your results concisely and objectively in...
Developing a well-written research paper is an important step in completing a scientific study. This paper is where the principle investigator and co-authors report the purpose, methods, findings, and conclusions of the study. A key element of writing a research paper is to clearly and objectively report the study's findings in the Results section.
The writing of the results section of a scientific paper is very important for the readers for clearly understanding of the study. This review summarizes the rules for writing the results section of a scientific paper and describes the use of tables and figures. ... As an example elucidating the abovementioned topics a research paper written by ...
III. Problems to Avoid. When writing the results section, avoid doing the following:. Discussing or interpreting your results.Save all this for the next section of your paper, although where appropriate, you should compare or contrast specific results to those found in other studies [e.g., "Similar to Smith [1990], one of the findings of this study is the strong correlation between motivation ...
The results section should aim to narrate the findings without trying to interpret or evaluate, and also provide a direction to the discussion section of the research paper. The results are reported and reveals the analysis. The analysis section is where the writer describes what was done with the data found.
The Results (also sometimes called Findings) section in an empirical research paper describes what the researcher(s) found when they analyzed their data. Its primary purpose is to use the data collected to answer the research question(s) posed in the introduction, even if the findings challenge the hypothesis.
Each design has a unique way of capturing the findings of a research paper. The two examples below show how students should write a results section in qualitative and quantitative research papers. However, students must note the language and details, such as statistical data.
The next stage of any research paper: writing the results section, announcing your findings to the world. In theory, this is the easiest part to write, because it is a straightforward commentary of exactly what you observed and found. In reality, it can be a little tricky, because it is very easy to include too much information and bury the ...
This is an example of the results section from a psychology research paper where authors are outlining their main findings. In this paper, the authors are investigating the effects of different types of music on people. The authors say that they found significant differences between classical and pop music in terms of memory recall.
The results section of a research paper refers to the part that represents the study's core findings from the methods that the researcher used to collect and analyze data. This section presents the results logically without interpretation or bias from the author. Thus, this part of a research paper sets up the read for evaluation and analysis ...
The "Results section" is the third most important anatomical structure of IMRAD (Introduction, Method and Material, Result, And Discussion) frameworks, the almost universally accepted framework in many journals in the late nineteenth century. 3 Before using a structured IMRAD format, research findings in scientific papers were presented in ...
The pages in this section cover the following topic areas related to the process of writing a research paper: Genre - This section will provide an overview for understanding the difference between an analytical and argumentative research paper. Choosing a Topic - This section will guide the student through the process of choosing topics ...
1. Generating Ideas And Topics. AI shouldn't do your writing for you. It lacks the necessary human context and isn't immune to errors. But it can be a powerful writing partner.
At baseline, the mean AHI was 51.5 events per hour in trial 1 and 49.5 events per hour in trial 2, and the mean body-mass index (BMI, the weight in kilograms divided by the square of the height in ...
The results immediately revealed some obvious trends in science. For example, the frequency of the word Ebola peaked in 2015 and zika in 2017. One of the biggest changes occurred in 2020 with a ...
Many popular large language models work by predicting the next word, or token, given some natural language input. While models like GPT-4 can be used to write programs, they embed those programs within natural language, which can lead to errors in the program reasoning or results. With NLEPs, the MIT researchers took the opposite approach.